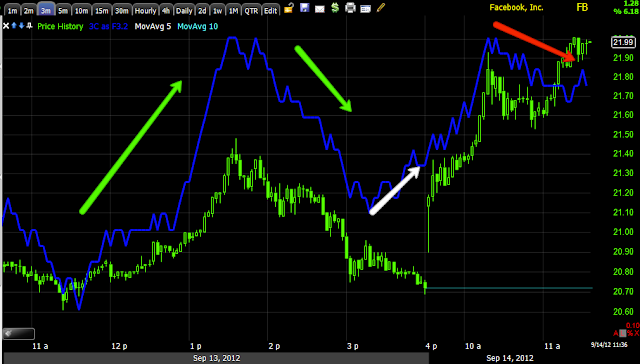
Our FB long is up nearly 6.25% today, it looks like it's hitting some profit taking in this area. There's also a gap, I'd consider taking some profits on options trades and maybe even on equity longs as there are a few signals that suggest a pullback in the coming days.
FB this morning 1 min with a late day positive divergence yesterday (confirmation of the price trend at the green arrows) and a negative relative divergence now.
2 min chart shows the exact same signals including yesterday's late day positive divergence, note it's enough to move the stock like this intraday, but this divergence alone is not enough to make a broad move. As you know the longer timeframe charts have been very positive suggesting a base and a larger move, but a constructive pullback is still very possible if not likely, that doesn't change anything about expectations for FB.
The 3 min chart gives the exact same signals as the other two, a positive divergence in to the close yesterday and a relative negative here. Relative negatives on these timeframes can cause simple consolidation or be the start of a larger divergence, but I have other reasons to suspect a constructive pullback.
Our X-over chart to avoid false crossovers is now giving 2 of 3 long signals and the 3rd one is moving toward giving a long signal. Typically after the signal, which could come today, there's a pullback to the 10-day moving average (yellow), which should move a bit higher between now and then.
The daily Trend Channel has enough information now to construct a stop which is around the $19.25 area on a close, there's not enough information however to decide whether this channel is wide enough. The gap can be seen in yellow, I'd suspect the 10-day ma would be somewhere in that area on a pullback in the coming days.
Is interest rates about to start going up?
-
Yes, I know - it does not make any sense - FED is about to cut
rates...but....real world interest rates are not always what FED wants it
to be.
6 years ago


No comments:
Post a Comment