Since my first interest is in post F_O_M_C underlying trade activity, I'm trying to focus on the faster timeframes that cover the approx. 6 hours of market trade since QE3 was announced, then I can determine whether there's a change in character or a reset or if the QE3 event was priced in and the longer term charts are still legitimate.
Thus far there's not any huge revelations, confirmation in many areas, but a few areas with some underlying weakness in the indicator, especially at about the 3 min chart going from yesterday's 3C intraday high to our intraday high thus far today, so far it almost seems to be acting as resistance.
Since these are fast charts, they should give good information, but they are also subject to fast changes.
Some updates may not have charts if I find something material that is moving fast and presents an opportunity or new information.
Lets use these as a sort of baseline...
DIA 1 min showing intraday confirmation today as 3C moves with price.
DIA 2 min showing confirmation yesterday since the F_O_M_C with a relative negative divergence at this morning's intraday high and a small leading negative divergence starting.
At 3 mins, since this chart is short enough to capture information from any potential changes since yesterday, it, for the time being, will be a key timeframe. We see yesterday's negative divergence at the 2:27 intraday highs and a broad move to what looks to be an out of line position or a slight leading negative divergence toward the afternoon. There's an intraday relative negative at this morning's intraday high and a slight leading negative divergence. The question on almost all of these 3 minute charts is whether there's a solid negative divergence on a relative or leading basis between yesterday and today thus far.
The IWM being one of the more important of the averages (Russell 2k) 1 min showing confirmation right up until 10:30 this morning.
The 2 min chart seems to be migrating the same set of readings with a slightly less developed leading negative presently as would be expected on a longer timeframe.
IWM 3 min with a relative negative at yesterday's intraday high and a relative negative that has sort of acted as resistance this morning, whether this 3 min worsens, gets better or sees price follow is important.
QQQ 1 min confirmation of the move up this a.m. to a relative negative divergence at the intraday highs and a deeper leading negative divergence since.
The 2 min chart is picking up on the leading negative divergence as I would expect as it is fairly sharp on the 1 min chart.
QQQ confirmation on the 3 min with that same 3 min relative negative divergence at the intraday highs this morning. The chart doesn't appear to be in any major trouble here, it seems like 3C just called out the pullback, but with the 1 and 2 min charts showing a leading negative that formed, it will be important if that divergence migrates to 3 min.
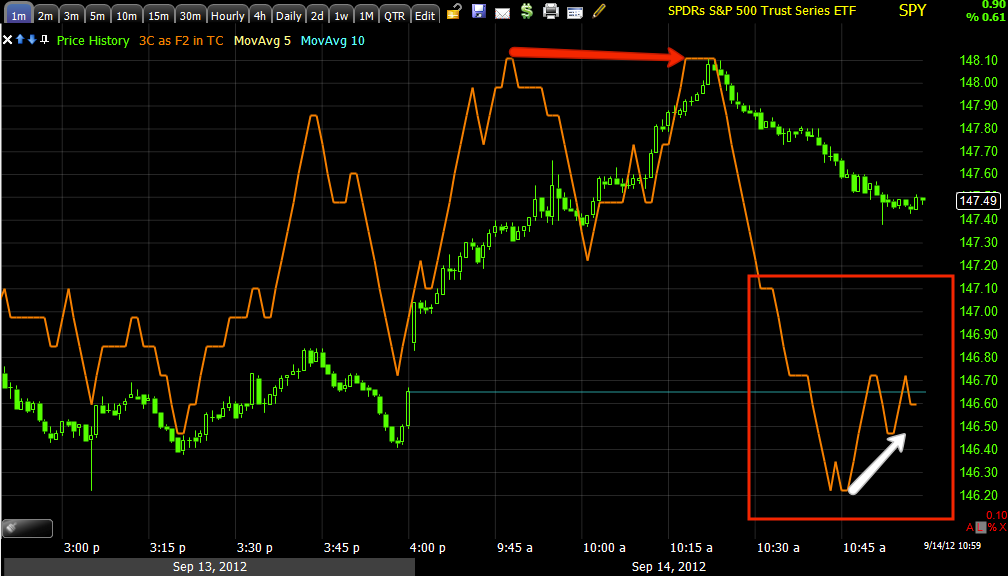
SPY 1 min with early confirmation of the open, negative at intraday highs turning it down and forming a leading negative divergence similar to the QQQ.
SPY 2 min intraday confirmation , in yellow 3C did make a slightly higher high so it's not officially negative, but it isn't as high as it should be, also the leading negative is migrating to the 2 min like the QQQ.
The question again of the 3 min chart and a relative negative divergence between the two 3C intraday highs.


No comments:
Post a Comment