So far all is well and as expected with FB as of last week, the pullback is taking shape which may offer an opportunity for those interested that aren't already in FB (long), of course as always with a pullback, we want to verify accumulation as price reaches their target area. I suppose if you were very nimble and had the time, you could even play the FB pullback with some leverage, however I'd prefer to trade on the side of probabilities and that's not where they are with FB.

Here's our X-Over Screen, used to weed out false crossover signals. The top window has a simple 10 and 22 bar moving average (yellow and blue respectively), the middle window has a custom indicator which is a series of conditions that must be met and a blue 22 bar moving average of the custom conditional indicator and at the bottom is Wilder's RSI (period 14). For a short signal which we probably had although FB doesn't offer quite enough information to put the moving averages together that far back, the 10 bar crossed below the 22 (for most traders this is where their moving average systems stop and as such see a number of false signals or whipsaws), the yellow custom indicator was likely below the blue moving average and RSI is below the 50 level, those 3 signals together give a short signal. As is the case either short or long, the first pullback is often to the yellow 10-bar moving average as you can see price on the short do at the red arrow. Subsequent pullbacks as the trend develops pullback deeper, by the 2nd or 3rd pullback it is often to the blue 22 bar moving average.
We are VERY close to a long signal now, the custom indicator just needs to cross its moving average which should happen soon, look for a pullback to the yellow 10-bar m.a.
The Trend Channel has just enough information to create a 1-day channel which is probably a little narrow for a longer trend, but for a swing move, it should be fine. The short is stopped out when price crosses above the lowest level of the upper channel on a closing basis (at the white arrow) and coincidentally the long stop is at the exact same place right now, which is the highest point of the lower channel on a closing basis. I prefer to use the Trend Channel on an established trend, in those situation, it's ability to call the end of a trend is incredible, with newly developing trends, you often need a little more room for the volatility of tops or bottoms.
We see a head fake move on the open today, there's a gap that may be filled at the white box, if it isn't filled, it becomes a very bullish break-away gap which would hint at a very strong momentum move.
FB 4 hour chart has a very strong leading positive divergence as well as a positive divergence right where we suspected a base would form and seems to have formed.
The hourly chart that gave such amazingly strong signals back in June, now makes those signals look almost imperceptible as the much larger and stronger positive divergence forms now.
Here's the 1 min chart and the immediate distribution of the opening gap higher, as with most reversals the head fake move is usually the first thing to occur.
The negative divergence for a pullback on the 5 min chart and in fact goes out to about 15 min, not as sharp or large though.
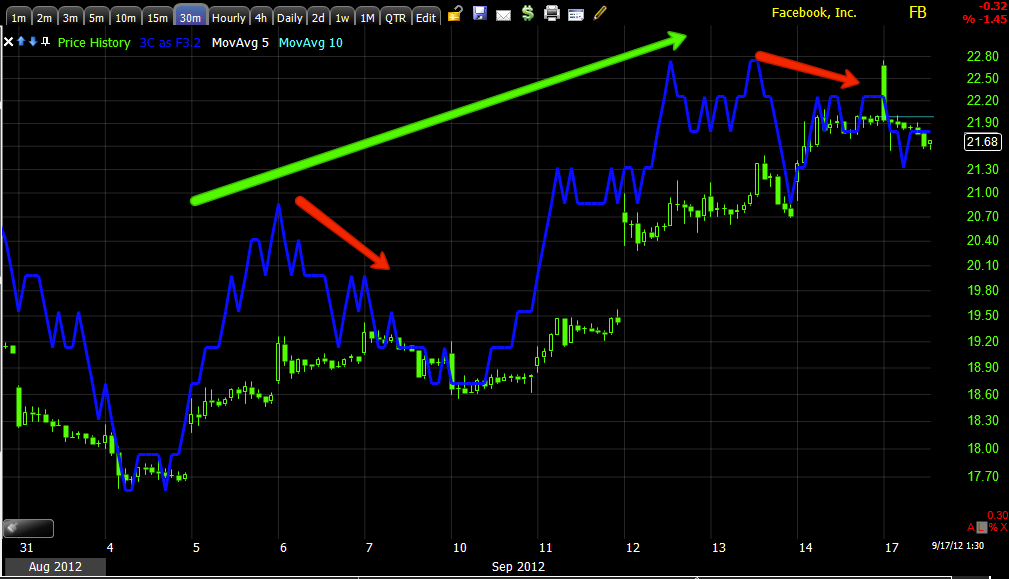
The 30 min chart shows the trend of confirmation with a couple of small divergences on pullback moves.
I'd be interested in additional or new positions in FB around the $20-$20.50 area.
You might want to set some price alerts.


No comments:
Post a Comment