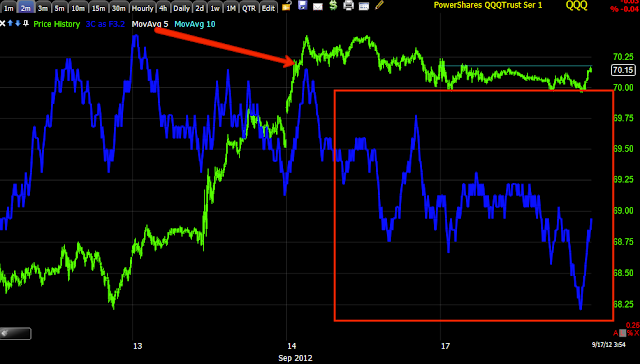
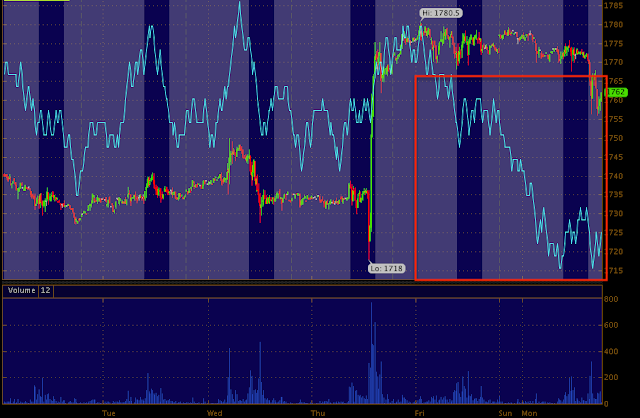
Those divergences were left over in to today, since there was a commitment already made as of Friday (the positive divergences), I figured at some point today that we'd see the move that Friday didn't bring.
Here's what the accumulation looked like in a few different areas of the market and what the longer view, but still post F_O_M_C in most cases, looks like.
I first pointed out an earlier divergence as the market had a downside hiccup around 2 p.m., here it was a relative positive divergence (not drawn), but later we had a second break that saw a positive divergence that was stronger, it should be noted that neither small drop did anything to stops, no obvious stop fishing was evident as volume remained steady and failed to surge on a cross below the typical stop levels on 3 of the 4 major averages.
DIA 5 min chart remains leading negative, but very close to having a relative positive divergence at roughly 3:15.
The IWM was one that moved quickly and strongly, yet on a 1 min chart.
Move to a 2 min chart of the IWM and it's still leading negative and the divergence shows up, but isn't all that impressive, yet it is the first positive divergence on this chart/timeframe since at least 1 pm last Thursday so it is something I'll need to pay attention to.
The IWM 5 min is almost exactly like the DIA 5 min with a leading negative divergence and a relative positive at the late afternoon positive.
QQQ 1 min positive divergence from Friday, the real action came at the last dip of the afternoon. The QQQ is the only among the 4 majors that showed a volume surge at a break of intraday support (stops getting hit).
The QQQ 2 min, unlike the IWM, isn't showing any positive information migrating through the timeframes
.
The QQQ 5 min looks like the DIA and IWM 5 min in that it is leading negative and quite deep, but also has a relative positive divergence in place at today's late afternoon dip to new lows on the day.
SPY 1 min, the SPY had to build a new positive divergence as Friday's was run over.
I didn't post these charts for each of the above averages in the interest of time, but many have charts that look like this on 10, 15 and even 30 min.
Light Sweet Crude Oil Futures
The 1 min chart shows deterioration in the Futures, at least on a short term basis, you may recall USO was giving negative signals as well, starting at the open and continuing through the day until the plunge.
This is a very different chart of Crude Futures, 30 min. There's a negative divergence noted at the far left sending price lower, a positive divergence at the low in CL sending price higher and in confirmation (meaning the trend is expected to hold until a new divergence takes place) then (and this is the reason I included it) you can see a very clear negative divergence in to the overnight session as well as today's day session until crude broke lower, 3C is now in the area it was at when crude's price was at the lows of the chart.
Gold mini Futures were roughly in line, but the contract is a bit spotty in 1 min trade which doesn't provide for the best signals.
The Gold 15 min chart takes care of that problem, you can see clear deterioration in 3C starting Friday, overnight last night and during the day session before gold made a short break to the downside. I see no positive divergence here at all.
The gold 30 min. futures chart also shows deterioration from Friday and continuing until today's drop . 3C is leading lower, in fact below its position at the price lows on the chart.
I'd like to look closer today at market breadth and I will, unfortunately those scans are pretty time intensive, but looking at the TICK Index reveals some breadth information.
While the downside moves were a little sharper than the upside moves, for the most part the dominant theme was the TICK chart spending the most time at the zero level or right in the middle, this is why I want to take a closer look at market breadth today.I'll post the results of those scans shortly.


No comments:
Post a Comment