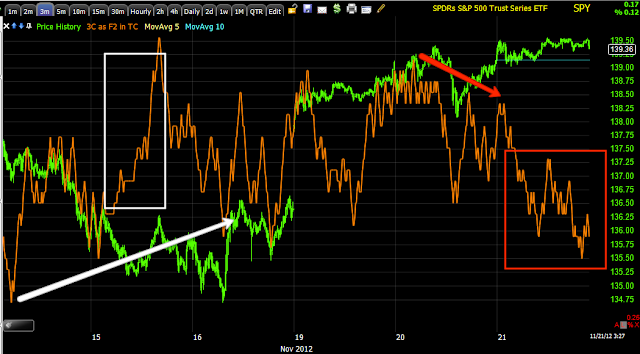
As I showed much earlier today the 1 min charts held together, this is not where you'd see any kind of big institutional movement, these are market makers and specialist, etc. So when you have prices rising and you look at the longer timeframes like 3, 5 or maybe 10 min charts today, if there wasn't accumulation that was commensurate with the price rise we'd see a negative divergence or a worsening one.
Since the only real trading today was very light as evidenced by the 1 min chart, it was likely the F_E_D buying whatever retail offers popped up just to hold prices in place and make today a non-issue in the news in front of Black Friday shopping. However since there wasn't any accumulation either (as evidenced by the slightly longer charts as they are waiting for a price pullback) it's only natural and only makes sense that the 3C divergences on the longer intraday timeframes would look worse and they do. I don't think this represents any real heavy distribution, it's just a function of how the indicator works, this is one of those days when you learn something new.
Here's what the charts look like in the Q's and I'll give a few examples from the other averages, bottom line though, it doesn't substantially effect anything that we expect or change anything in underlying trade, it was just a day in which any pullback was delayed.
Oh, lastly, it would be VERY strange not to see some downdraft in to the close as traders take off risk over a long weekend as many won't come in Friday.
QQQ 1 min a little negative, but not much movement
2 min seeing a little worsening development
3 min is where we'd expect to see worse readings as any support would be small and wouldn't reach the longer charts.
3 min trend is definitely worse, at least looking.
5 min definitely worse as there would be no buying showing up here because it would be way too small.

DIA 1 min, nothing here.
However to get a negative on the 15 min chart today is a lot of movement even though it looks small, it's a long chart and where bigger transactions show up.

IWM 1 min nothing special
IWM 5 min getting worse on a leading move
The SPY is showing some late day 1 min negative action
3 min trend is clearly worse
As is the 5 min.
Again though, most of this is a function of non-participation by institutional money with price moving up and without the institutional support on those timeframes.


No comments:
Post a Comment