SCO is the leveraged Short Crude Oil position posted earlier today. The entire puzzle really fits together and centers on the FX market, specifically the EUR/USD or even more specifically, the $USD as oil and most commodities across the world are traded in US Dollars so changes in the value of the $USD automatically effect prices in $USD denominated assets. If the oil cartel is selling oil at $100 a barrel and the $USD falls, the $100 they were selling oil for is worth less so they have to adjust the price of oil up to compensate. There are of course a number of other pricing pressures in oil: Geo-politics, supply/demand, domestic politics and the SPR, costs, loss of capacity (like a broken oil pipeline, a hurricane shutting down off shore rigs, etc.).
Here are 3 different, but confirming assets for this trade, USO which is the US Oil Fund, /CL which is Brent Crude Futures and SCO which is the 2x leveraged short Crude ETF. That's 3 different assets that trade entirely differently, especially the futures, they should confirm each other for a high probability trade.
I'll keep USO (above) next to Crude Futures (below) in similar timeframes so you can see if the signals are similar. Since these are two different charting platforms, the one below has its own version of 3C, it's not the same as the one above, but it is robust and gives good signals so any similar signals are even more likely to be accurate.
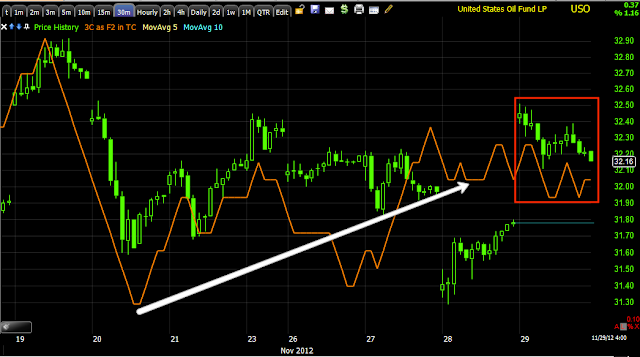
On the 1 min USO chart today we see early distribution as USO gaps up, there's a small positive divergence sending USO higher (usually so a market maker/specialist working an order can sell at higher prices rather than consecutively lower prices). By the 2 p.m. bounce there's clear distribution in USO and by the end of the day 3C is leading negative which is the strongest divergence type.
This is /CL (Brent Crude Futures), since this trades 24 hours during the trading week you won't see many gaps except at the start of a new week after futures have been closed over the weekend. You can easily see though where today's regular hours trade was by looking at volume or the date/time at the bottom. We have the same distribution areas intraday and the same leading negative divergence by the close, just like USO.
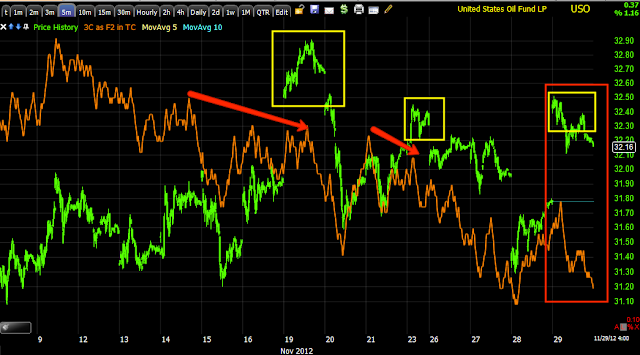
On a longer 5 min timeframe (this is usually where we first see larger institutional orders in divergences-the longer the timeframe, the more meaningful/reliable the divergence. On the 19th price makes a move above resistance, that move sees a negative 3C divergence rather than 3C moving higher with price and the move fails, this is a head fake move and usually leads to a sharp sell-off which you can see the next day with a virtually vertical drop in to the 20th of this month. There are a few smaller head fakes and today's, these are meant to bring longs in and shares are sold/distributed to retail longs who are holding the bag when price drops, but a big gap up like today's is enticing to retail longs, they chase price and call if "confirmation", as they feel that is the safest way to enter-after you already see price move, but I disagree. Today's gap up saw 3C sit in place, not move up to confirm the move so it's likely there was distribution in a big way today as traders bought the gap up, also known as a "Bull Trap" and one of the reasons stocks fall so fast after a failed move-you can work out the reason why if you imagine you where the buyer and how you'd react when a stock you just bought sees a dramatic decline the next day.
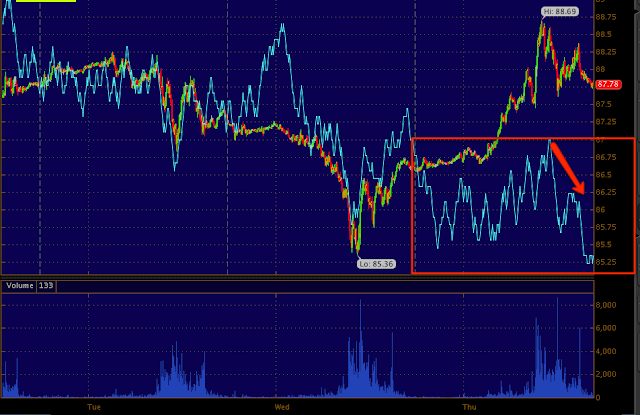
Although /CL won't show the gap up this morning because it traded overnight continuously, you can see the same negative divergence in to today's highs as the USO chart above.
Here's a 30 min USO chart, which is as far as I'd go with this trade, there's not a lot of detail here, but the trend is obvious, 3C was positive at yesterday's lows (smart money buys low and sells high) and today on the gap up 3C didn't make a new high, in fact it fell a bit.
The /CL 60 min. chart shows exactly why I consider this a shorter term trade (days to week/s), there's a larger positive divergence building (white arrow) and one of the reasons crude may come down (we are trading it short) is so this larger base can continue buying crude at lower prices as they are toward the top of the range and that's likely out of the accumulation area.
Before that you can see a negative divergence in to what I would call a parabolic price run at the far left (remember these almost always fall just as fast as they go up) and then there's a breakout above resistance to a new high, this is what smart money needs to sell shares short to bring prices back down, buyers who are willing to buy and retail is willing to provide the demand smart money needs to unload the shares as retail considers it confirmation of a breakout above resistance, where as for smart money it's a simple bull trap and when prices fall, retail's selling will cause more supply and lower prices, most of the time smart money would not only sell up there, but take a short position too for the decline back in to the accumulation zone.
Now SCO-the 2x leveraged SHORT ETF for Crude
We should see almost exactly opposite price action and 3C signals when compared to USO or even /CL. Today at the lows we see positive divergences, you can actually see where the bulk of the accumulation occurred. Just as USO and CL ended the day with a leading negative divergence, SCO ended it with a leading positive divergence.
On a 2 min chart you can see where SCO was sold by smart money or middle men and where the positive divergence picks up -again in leading positive position so the early analysis was supported by closing trade.
The 5 min SCO chart shows a head fake area above resistance, note it doesn't have to be much above resistance because traders look at support and resistance as exact levels like $1401.23, which is crazy if you think about the emotional reasons support and resistance form, this is why it's so easy for Wall Street to got on fishing expeditions for stops, not only do they know (as do we) exactly where the stops will be (to the penny), most traders place stop orders with their brokers so they are on the books for all who have access to something like TotalView to see. In any case the point here is the positive divergence at lower lows in price and the leading positive divergence at the end of the day. So I like SCO even more than I did when I talked about it earlier today.


No comments:
Post a Comment