I was going to do this in 1 full update, but there's good information here that I think is actionable and I don't want to wait on getting it out. I started to notate the charts, but I didn't think you even needed that, I think you'll be able to see clearly so I'll just put timeframes.
Other than the post last night of futures and all the confirmation between assets and timeframes, just trade today is telling you something about the market, a nice gap up and it lets go of it all, TICK moving to extremes after being so mediocre last week at the end of the week...
Since most of you probably already know what the longer or intermediate term 3C charts on the averages look like, I'm just going to put 1 medium term and 1 short term for today's action. A few charts have notations on them, then I realized you don't even need them.
The DIA 1 min is the only and most neutral intraday chart of the averages, I just wanted to note that.
DIA 15 min
IWM 1 min
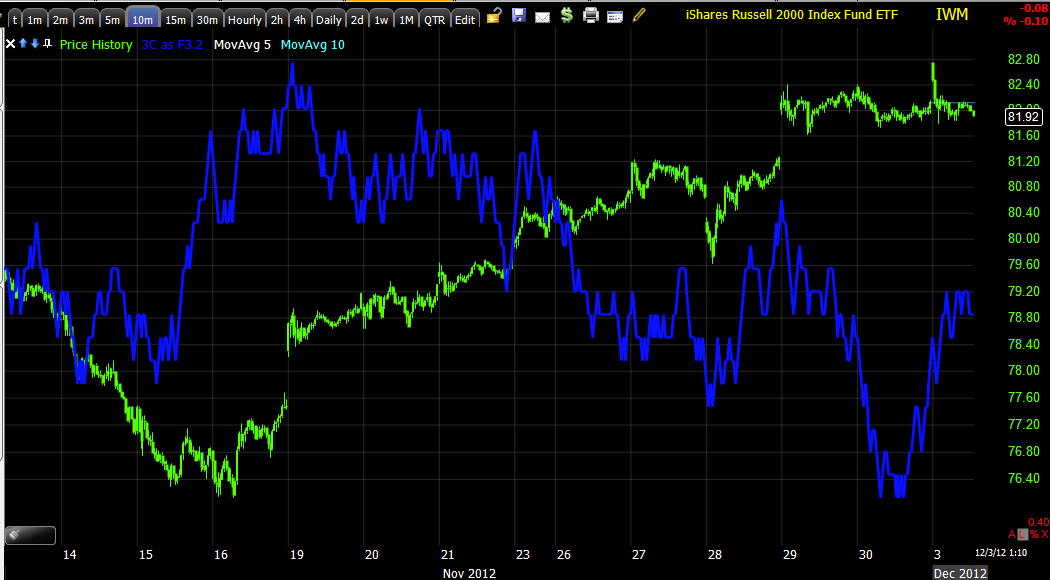
IWM 10 min
QQQ 1 min
QQQ 15 min

SPY 1 min
SPY 10 min.
As for breadth (as the averages' weight can sometimes be deceiving)...
Today's TICK chart, still not seeing much above +500, a little area of some +750, still very mediocre except the open, the downside is pretty consistently in the -750 with spike in the -1250 area so breadth looks appropriate for price action, I don't see any Index weighting issues skewing anything.


No comments:
Post a Comment