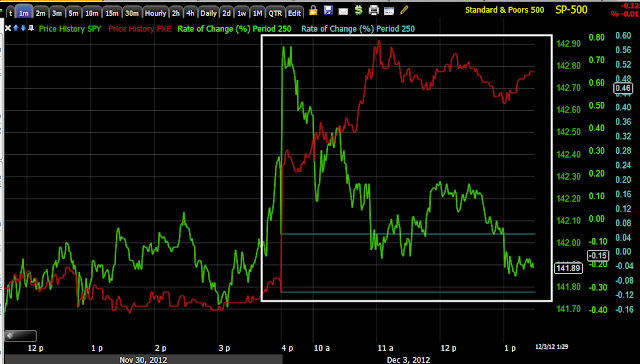
You saw the charts last week, I think my AAPL Add-To Put made my feelings on the market pretty clear. You saw a huge number of futures charts from equity indices to Currencies, etc in a number of different timeframes all confirming each other, all very ugly for the market near term.
You saw the 3C market update charts in the last post, the TICK confirming the breadth of the move and now I'm going to show you the leading indicators, as far as I can tell the only thing lending support to the market right now is the EUR/USD and I don't know if it can lend enough support, I also wouldn't say its own 3C charts back the currency pair maintaining strength much longer.
So in my opinion, everything is in place, the charts look the way they should and you'll see the leading indicators now, the legacy arbitrage of EUR/USD seems to be the only thing left and the market is not even responding to that very well intraday.
First the $AUD which is easily my favorite leading indicator among currencies because it is sensitive to China and is big component in the Dollar Carry trade which is kind of like foot prints of hedge fund activity, a negative divergence between $AUD (red) and the S&P-500 (green) has never been a good thing for the market, it should be noted that $AUD positive divergences work well for market upside too. This divergence is pretty clear.
The EUR/USD (in this case the EUR component) is trading rich to the market, this "should" lift the market in a legacy arbitrage trading scheme, as stocks would appear to computers to be VERY cheap, but no one is biting. As I mentioned there's good 3C evidence on the EUR/USD, on Euro Futures and the US Dollar Index that the EUR/USD pair isn't going to be able to hold up her much longer and as far as I can tell it is the ONLY string supporting the market at all.
FCT which just happens to be one of those weird assets that has a GREAT record as a leading indicator with the market (through back testing) is in a negative divergence with the SPX.
Here's where it gets important because institutional money needs to take large positions, that's not always easy to do in stocks without moving the market, however Credit is a much larger market and they can and do show sentiment in their buying or selling of High Yield (risk on/Rally) credit or Investment Grade( risk off/flight to safety).
Here Junk Credit which is high yield because it is junk, is showing a lack of confirmation late Friday on the market's pop toward the close and it gapped down (red square) today vs the SPX gapping up (white square), so they are totally inverse or divergent, not good for the market.
High Yield Credit itself is also very telling, here it is trending down with the SPX intraday, but take a little longer view...
There's a small positive divergence in Credit at the white box and a leading negative divergence currently.
Finally High Yield Corporate Credit which is very liquid also didn't participate late Friday, it gapped down today while the SPX gapped up and taking a look at 3C for this more liquid form of credit...


No comments:
Post a Comment