Around 1 p.m. I put out an AAPL post that we were in an area in which I'd consider AAPL shares long, but not options, I didn't feel the signals were strong enough for that, I even suggested maybe as a day trade. Since then AAPL has given about 4 or 5 points on the upside, but it's interesting right now and I'm not sure what it means yet, but there's some transition of some sort going on. If you are long AAPL whether day trade or otherwise, I'd urge caution and just pay attention, maybe even a trailing stop (not with your broker-like a moving average or channel).
The 1 min chart is in line, the only thing that stands out is the gap up opening that was sold off right on the open which we see a lot in AAPL lately, in fact I'd call it a trait that is so consistent, I'd manage my trades in AAPL based on that behavior.
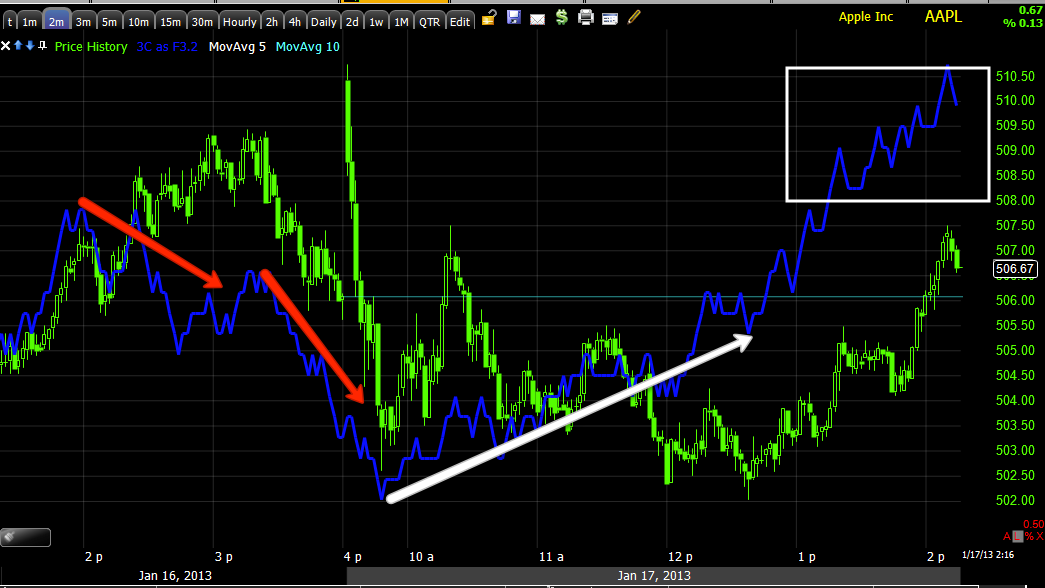
These longer intraday charts are why I liked AAPL, but without leverage, basically being a bit more cautious. 2 min
3 min shows the gap sell-off and the positive divergence that I liked.
5 min shows the same.
At 10 min the bigger picture chart doesn't seem to be abnormal or any cause for concern until you look a bit closer at recent action. This chart takes a bit longer to react and its signals are more important so I found that interesting, it may be just noise, but this is why I say "pay attention".
A closer view of the 15 min chart shows something similar, rather than the positive divergence from the shorter timeframes migrating to thee longer ones, there's this bit of strange initial activity.
This isn't enough for me to take any action other than to be careful and pay attention, but I need to point that out given the earlier post.


 | Theme by Thur
No comments:
Post a Comment