I'm going to be looking for a place to close the smaller Jan. SPY 140 calls, I'll probably close another half of the Jan SPY $145 Calls and another half of the QQQ Jan. 66 Calls.
As I said earlier, if I feel there's a good play on more upside, I'd rather use ETFs with 2-3 leverage than watch the time decay eat away at the calls.
Some of the things I said I'd be watching for on the Futures charts are showing up, this doesn't mean we can't still move higher, indeed I think it's likely, but even more likely I think is the probability that the reversal (when it comes) moves very fast. We are already seeing some pretty fast signal changes.
The 1 min positive in SPX Futures held long enough to put Es in to a lateral consolidation which is one of the two options for a 1 min positive divergence, since then it has started to deteriorate a bit.
The ES and NQ 15 min charts were what I was really interested in as I posted I believe last night or first thing this morning. The positive divergence is CLEAR, the fact 3C is starting to go a little negative on a 15 min chart is not good for the move on the upside.
NQ 1 min positive held NQ laterally for a while, but now that's starting to deteriorate.
The NQ 5 min chart is showing clear deterioration and this is a longer, more important and cleaner signal than the 1 min, so this should migrate to longer timeframes.
While the positive in NQ 15 min was quite obvious, right now 3C and price are in line, but with that 5 min in a leading negative divergence, it shouldn't be long before this chart starts to fall apart as well.
SPY as an example for the rest of the market (although each is a bit different, like the Q's have had better underlying strength since last week, thus the QQQ calls Friday).
1 min has had plenty of time, it's the fastest moving chart, it has not confirmed price's upside.
3 min is also in a leading negative position.
At 5 min we go from confirmation to a leading positive divergence, this is the left over from the divergence that got this move going on the upside, the 1, 3, min etc, will make it to the 5 min chart and it too will deteriorate.
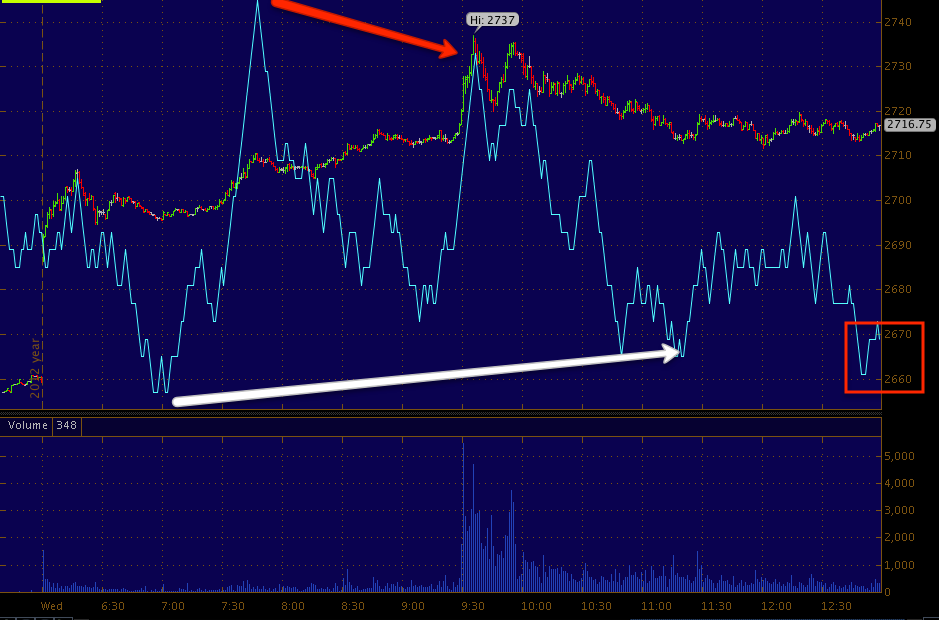
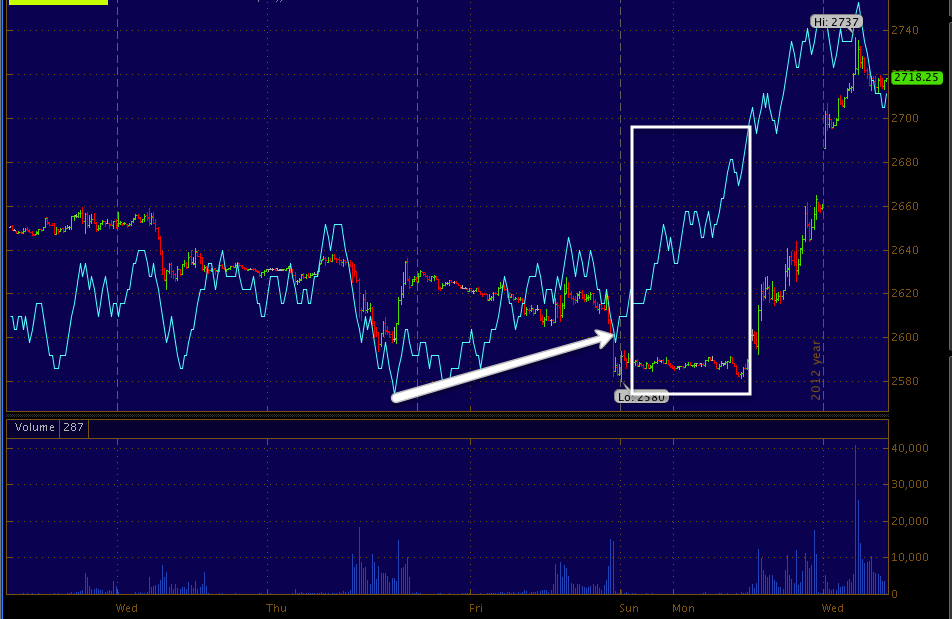
On a 15 min chart we have a SHARP leading negative divergence and a head fake move, both very common before a reversal (to the downside) and this I believe is our evidence of Trend #2, which is a longer move to the downside, likely taking out the 11/16 lows that started this cycle.
I don't want to add to the shorts already in place for trend 2 yet, I'm still thinking about management of Trend 1's pop, but I think you should think about a few ideas you might want to pursue as this could happen very fast, I wouldn't be surprised if it happened intraday rather than overnight.


No comments:
Post a Comment