Here are the charts for XLK, TECL and TECS as a confirmation asset.
There's the gap mentioned, there's several stops within the area, the most obvious of course is below the lows of the last 2 days, but if I did that it would not be right at the lows, give it a little room, you know how those orders always get hit.
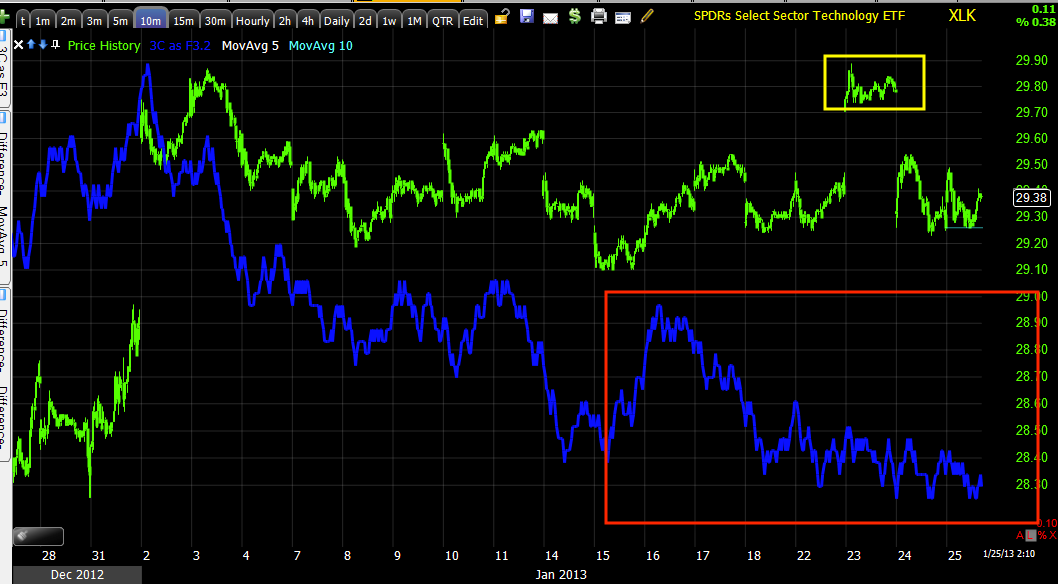
XLK
This is only a 2 min chart, but it is leading positive in a pretty big way.
This is a 10 min chart, there's no sign of anything positive here, that's why I think it's a short term trade just to fill in that gap.
TECL (3x long Technology)
The same 2 min leading positive as XLK.
There's some migration to the 3 min chart with another leading positive. If the divergence were on the 1 min chart only, I'd say it's consolidation, but beyond the 1 min chart and the probabilities go up.

Here we even have it on the 5 min chart.
And impressively, on the 10 min chart. When I saw this I thought this may be more than just a gap fill.
However out at 15 mins and there's no sign of anything positive so I don't see this as too much more than what it was pitched as.
TECS (3x short Technology).
This should give signals that are roughly the mirror opposite of XLK and TECL above.
3 min chart is leading negative.
5 min leading negative.
However capping the move, the 10 min is in leading positive position, it could be more impressive, but there are no signs of anything negative there so it looks again like the move is capped to a shorter term move.
The 30 min chart of TECS is in an impressive leading positive divergence so I'd probably want to try to tide TECL up a bit and then use that price strength in TECL (weakness in TECS) to buy TECS at a better price with less risk and higher probabilities. This is letting the trade come to you, just taking advantage of the journey along the way as well.


 | Theme by Thur
No comments:
Post a Comment