We watch and trade both VXX and UVXY, UVXY is a bit trickier to trade, but one of the positions in the equity model portfolio is VXX which is at a 50% regular size position so it can be added to and I probably will do that very soon.
Volatility also helps us with timing a move/reversal as it trades opposite the market.
Here's a look at VXX (VIX Short Term Futures) and UVXY (The same but leveraged)


SPY 1 min intraday divergence at the end of day, as the SPY moved lower there appears to have been short term accumulation, thus I don't think the signals are quite strong enough yet to say this move is over. Also note the intraday 1 min negative divergence (these are often market makers and specialists trading their own accounts or adjusting inventory for an impending move they know is coming.) That negative divergence was in place before the 2 p.m. release of the F_O_M_C minutes which the market reacted negatively too, so someone was distributing, either selling or selling short for about 45 minutes before the minutes were released.
On to Volatility... UVXY
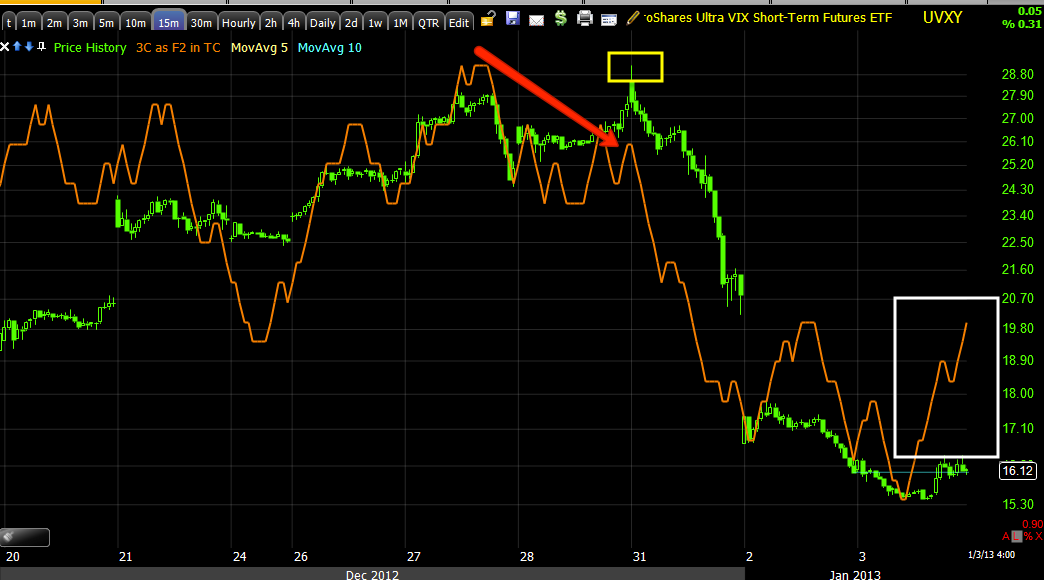
On a 3 min chart with a divergence that shoots up to the top of the chart, we have strong intraday move coming or the divergence will continue to migrate through the longer timeframes, but put it up against this 15 min chart that would not look as impressive, and the 15 min chart is about 10 times more important.

Here you can see the 3 min UVXY and it is sharper, larger, but it's not as important as the 15 min above. We do however get more detail, we can see for instance a head fake move Friday as the market hit a new local low and volatility hit a new local high-both moves centered on support and resistance, thus this is a head fake move (probably more of a result of the inverse correlation in which the real head fake was in the market, but it could catch a few traders with orders above resistance). Today's migration through the timeframes in volatility is usually a pretty good sign that we are near a reversal point.
VXX


Here as mentioned above, you can see how the 5 min (less important than the 10 min) is showing a stronger "looking" positive divergence, in reality the 10 min chart is stronger, but this is how these charts will look as the divergence migrates through timeframes which means it is a healthy, strong divergence.
I'll be taking a look tomorrow and seeing about adding to VXX in anticipation of Trend #2, a longer term move down that should take out the 11/16 lows (and probably a lot more as I reminded you today, the market always moves further than what seems reasonable).


No comments:
Post a Comment