There will be more, I have to put out these shorter updates because things are moving faster than I can cover in 1 update.
First I want to show you the typical Put position signal in SPX and NASDAQ futures we have been taking using weekly options in trades that last 1 to 2 days max and have been hugely successful.
This is today's 5 min SPX futures chart with a negative divergence, the reason I didn't want to enter weekly puts is #1 I don't want to be day trading them, I want a signal strong enough to give us at least a 1- 2 day move as the probabilities are higher. Now compare the above 5 min ES chart to the one last week in which we did take out some weekly puts.
This is from last week, the divergence is bigger, it is in to rising prices so it's giving a better signal, higher probabilities and
we entered SPY puts as you can see at this link.
The 5 min NASDAQ futures 3C chart, it does look good for a day trade, but those are not the probabilities I want to chase and chase you would.
Last week's clean signal of a negative 5 min 3C divergence in to rising prices, not at an apex turning point.
So we'll see what the market gives and what we can take from it, but today just feel like a lot of "First day of the week" emotional volatility.
As for the futures intraday...
If you look above at today's 5 min 3C charts for ES and NQ, they have a leading negative position so as of this moment, the highest probability trade is to short price strength. The 1 min ES chart above shows 3C making a relative positive divergences, this isn't a huge or strong signal, but it's a change in character and that's what is important.
The NASDAQ 1 min futures 3C chart also has a relative positive divergence, I would suspect there would need to be some lateral consolidation rather than a "V" shaped reversal, but I do think this is a change in character and if I had taken the Put/short trade early this morning, I'd be closing it now.
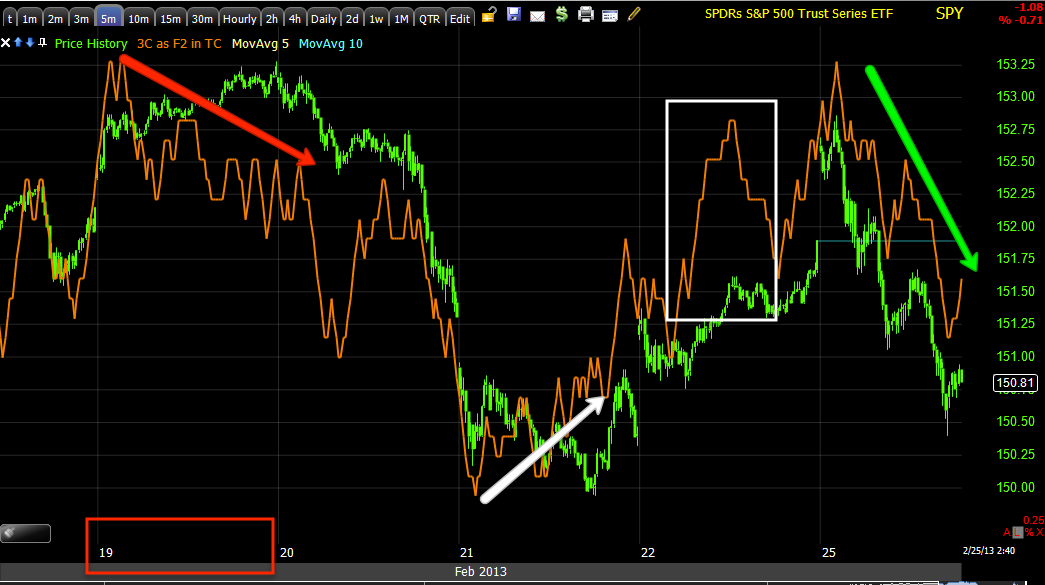
As for the averages, again these are not strong signals that I would trade, but they are changes in character which precede changes in trends. Note some of the charts below and the 3C signal on the 19th of last week when the SPY Puts (weekly) were opened, there was good confirmation.
DIA 1 min intraday showing some strength late Friday as we expected an early pop on the open this week to sell the calls we held over the weekend in to, the first red arrow from the left is the negative divergence this morning, a clear signal to sell those calls. It's not what you see in the DIA presently, it's what you don't, 3C and price have synced up, 3C isn't more negative than price.
DIA 5 min chart shows the negative divergence shown above in the futures, this is good confirmation for a high probability trade, then the 21st a leading positive divergence, we were in Calls I believe by then, definitely on Friday and a large relative negative divergence at this morning's highs, another clear signal to close the calls at a profit.
QQQ 2 min chart, also showing the negative divergence o the 19th as above in the futures, we see this morning's negative at the intraday highs and a current relative positive divergence, a definitive change in character, not one I'd trade, but a change.
This is a closer look at the same chart above.
SPY 5 min also going negative in to the 19/20th and positive in to the 21st as well as late Friday, this is why we held, to sell in to some more strength which we saw this morning, the SPY is in line or maybe a bit better so this is not a market I want to short right now with term trades and it isn't providing the price strength either yet to short in to for longer term trades, this is just a market to gather information and be patient, things can change on a dime.


No comments:
Post a Comment