As for the newer GLD April monthly Call entered Friday I said in that very post,
"I know this is not good risk management and I don't encourage it, but I feel I have to go for it.
I went with April 20th (Friday 19th) monthly expiration, long $150 calls, full size."
Now this is my own personal preference with regard to how to use options, I don't look at them as a lottery ticket to score 200% gains, I look at them as a tool to increase the leverage on a good looking trade that might not otherwise be as attractive to me due to a risk:reward imbalance.
If I like a position longer term, I'm usually going to use an expiration that is about double the length I think I need and I prefer an in the money strike so I'm not taking options positions that are going to give me the highest reward, I'm going for ones that I think will let the trade work, that are a bit more quality and make the risk:reward balance more appealing.
Having two full size option positions in GLD (March and April) is not good risk management in my view, so if I need to trim one down, I'm going to trim down the March as the April gives me more time and it's already up nearly 25% in a day.
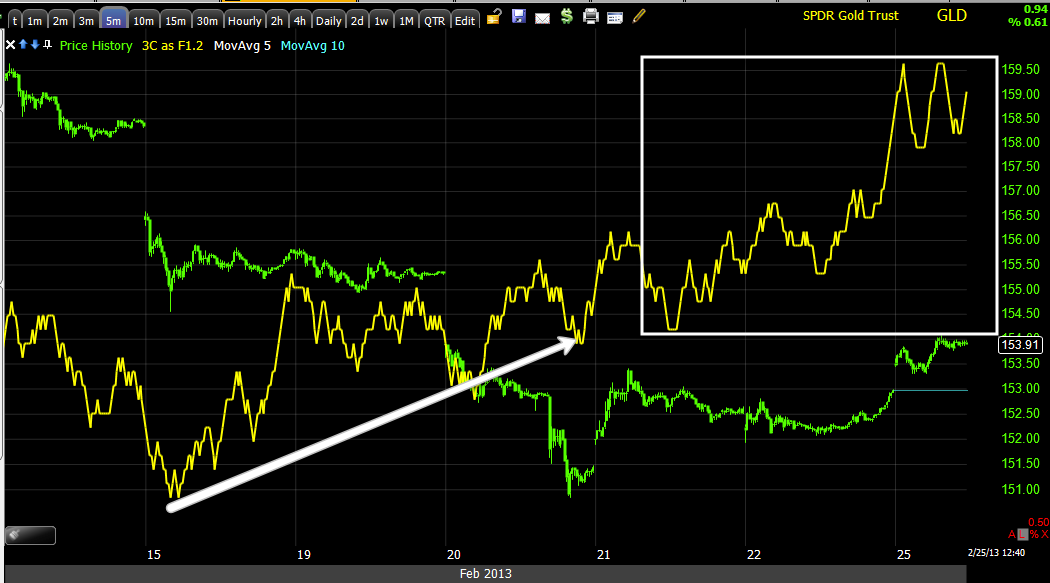
Here's what I see in GLD that made it seem reasonable to take action on the March position now...
As far as the historical Precious metal/$USD relationship...

GLD in green vs the $USD (UUP) in red makes sense at the white arrows, where Gold/GLD is starting to move to the upside is where the historical relationship (this obviously has not been a hard and fast rule, especially the last 4 years) makes less sense and is part of the reason I think Gold is up to something entirely different, the COMEX lowering of margin on the PM's as well also had me a bit suspicious something more was going on; I don't know what that is, I'm just following the charts and I'm sure we'll find out later, but for now it's not important to me.


"IF" gold/GLD fills this gap, this may be an excellent spot to add to a position or start a new position, we want to make sure though that the signals at that point are still positive and then enter any trades you might feel appropriate.


As for the YG/Gold E-mini Futures...


This is the YG/gold futures 60 min chart showing a negative divergence in red at the highs sending gold lower and a positive divergence in to the lows which I believe will send Gold higher from here as we move forward.
What we are really looking at with the different timeframes are probabilities of what happens short term (intraday or a day or two) and longer term-perhaps weeks, months even. I look at this as strategic vs. tactical, the longer term positive disposition is the strategic view, a short term pullback offers an excellent tactical entry.
We'll keep an eye on what's going on and see if there's a decent tactical entry, but I still like Gold very much going forward.


No comments:
Post a Comment