Other than the 1 min positive in NQ and the likely positive in ES, we have some other momentum and 3C based indications that argue for the move to continue which is hard to say because it never really got moving to start with, just barely.
Here are the indications, they are all short term in nature, nothing has changed about the fundamentals of the plan for today except maybe the timing, we have a little more than an hour to go, we'd have to see some really fast movement and then signals for a reversal in a short period of time, I don't think it gets completed today, but I do think it gets completed, but I could be wrong, it could complete today.
****And since starting this post that was meant to show how the market is about to move to the upside, it has moved to the upside. I captured all of the charts from here to the last SPY chart before I saw it move and I will leave those as they might help you as tools for future use, the others are longer term charts because the short term doesn't matter now that the market is moving, the long term matter as to what we do with the move in the market*****
Uptrend in the TICK chart from -1000 to +1000 and a break above the channel should start a move higher than what we have seen,
My custom Histogram for TICK at the bottom is positive as well, just like reading MACD.
Momentum has retaken the 5 min 50 bar average and the Trend Channel
The SPY 1 min is positive and better than in line, slightly leading positive
However not much strength beyond that, at 3 mins we have a small divergence
At 5 min a leading negative the last 2 days
Migration of the negative has hit the 15 min leading negative
Longer term since the new up cycle started on November 16th, we have a deep leading negative divergence, this is not for timing, this is to give you an idea of the scale / scope of how negative the market is and give us an idea of how bad the downside will be.
Now charts captured after...
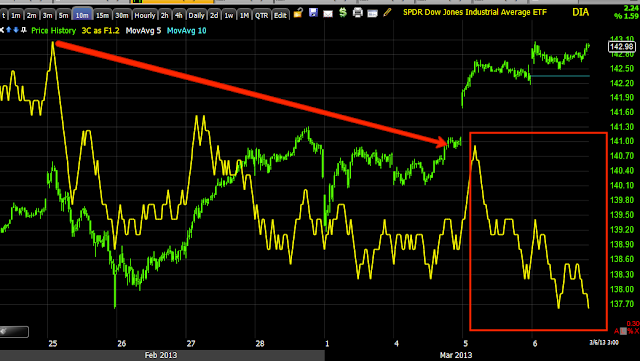
DIA 10 min leading negative
DIA 30 min leading negative
IWM 10 min leading negative, but I do wonder if the IWM takes out resistance at the yellow trendline?
IWM 30 min leading negative
IWM 60 min leading negative as well as some longer and shorter term divergences
QQQ in line on the downside, leading negative 5 min
QQQ 30 min leading negative
Is interest rates about to start going up?
-
Yes, I know - it does not make any sense - FED is about to cut
rates...but....real world interest rates are not always what FED wants it
to be.
6 years ago


No comments:
Post a Comment