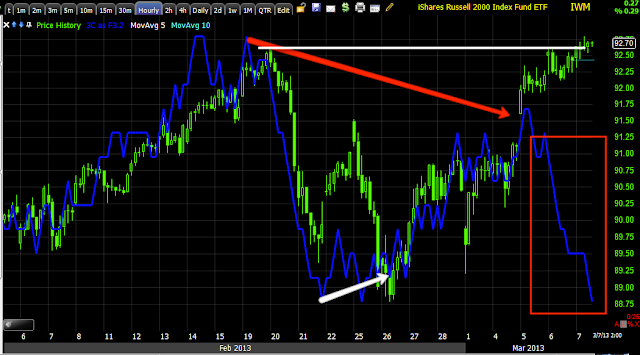
I mentioned earlier that I was watching the IWM closely, here's what I'm watching and so far it's moving in the right direction.
Today's trade is obviously very choppy, but the iWM made that high above local resistance that I was talking about yesterday during the day and in the nightly wrap, if it were another average it might not be as important, but the IWM should always be the leader of a risk on move.
When there are a series of shorter term, even intraday divergences and they disappear, it doesn't mean they didn't have an effect, it's accrual. It would be like you making a series of small deposits in a savings account, although each is nothing big, the series of them accrues in to a larger sum, it is often the same with distribution and accumulation because of the size of their orders, they often break them up in to smaller orders and if there's a trend among the small divergences it can show up on the longer term charts just as your bank account's balance would show a large amount despite the small deposit you were making that day.
So we'll start from the long charts, the balance or accrual area for the IWM and work toward the middle timeframes.
This is the 60 min chart, one of the most important, highest probabilities and cleanest underlying trend, also one of the strongest signals and here we show accrual of divergences, especially recently as the 60 min is leading negative off only a very small positive divergence to send it higher, not enough to be an accumulation zone for a big upside move.
We have the same on the 30 min chart, it shows more detail and both tops negative, but like the 60 min, this most recent move to the upside is leading negative much deeper.
The 15 min chart under less extreme market scenarios is the swing chart where many turns occur, four our purposes though we are just looking for a leading negative divergence which helps confirm the above charts.
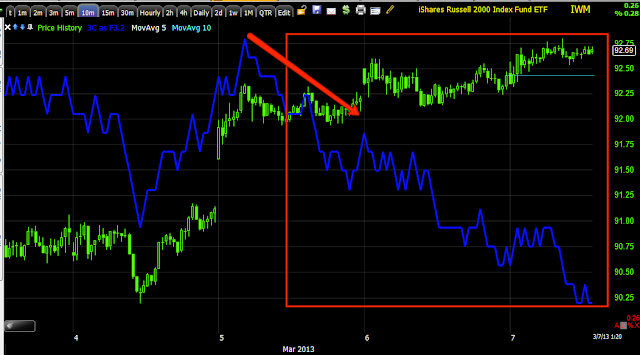
The 10 min is shorter and therefore more detail and sharper, it too is leading negative. Now we will start from the fastest charts and work toward meeting the 10 min chart. This is what I have been watching.
The intraday 2 min chart went negative at the highs of today and then leading negative, i want to see this divergence migrate to the next longest timeframe.
On the 3 min chart we have the same, as the IWM hits the intraday highs, distribution sets in and it is leading negative, now only the 5 min charts stands between connecting the intraday divergences and the long term divergneces.
And the migration of the neg. divergence is now on the 5 min chart, leading negative. The worse it gets the better.
As for our intraday momentum, it's starting to look "not so good too"
Is interest rates about to start going up?
-
Yes, I know - it does not make any sense - FED is about to cut
rates...but....real world interest rates are not always what FED wants it
to be.
6 years ago


No comments:
Post a Comment