SPY arbitrage shows some clear manipulation of one or several of the levers used to manipulate the SPY higher intraday.
A SPY Arbitrage capture around 11:15 shows the levers being pulled with a positive $.30 differential.
A more recent capture as of about 11:45 shown an increasing SPY model as the arbitrage model has now moved to a positive $.50 differential.
CONTEXT for ES was and still is negative as the CONTEXT model goes, but the differential moved from -$8 points to -$4 points as the model improves.
As for the levers, HYG, even though it took a pretty good whack today is seeing better intraday relative performance recently.
HYG 5 min chart shows the actual performance vs the SPX with obvious manipulation as HYG forms a positive divergence in mid-March and sends the SPX (green) higher, today's clear negative divergence sends the SPX lower, but intraday there seems to be an application of the brakes on the downside move.
HYG longer term fell out of sync with the SPX back in February, there was some obvious manipulation of HYG once real money in credit took off, but the fast drop put HYG is a short squeeze situation in which it was easy to use HYG to push the SPX higher. As breadth in the market deteriorated so did HYG's price action, a clear negative divergence has formed at the top of the short squeeze (yellow).

However as mentioned, the initial HYG signals along with pre-market futures signals (also negative divergences) have given way to better intraday relative performance in HYG as the SPX (green moves lower) while HYg (light blue) heads higher. The red trendline is HYG's close from Thursday, the green trendline and light blue trendline represent the SPX and HYG 10 a.m. lows respectively as a way to compare intraday relative performance since.
HYG's 1 min 3C chart shows recent positive divergences helping HYG intraday.
3 min positives are apparent as well
So are 5 min HYG positive divergences

The 10 min HYG chart shows the 3C negative divergence sending HYG lower as well as a positive divergence that formed support today in HYG.
The same can be seen al the way out to 15 min charts.
Junk credit (JNK) moves much like High Yield Corp. (HYG) as you can see it also started today with a much more negative divergence vs. the SPV and an intraday relative positive divergence.
HIO is not used as a lever so it's a good indication of real organic sentiment which, despite some indications that would seem contrary short term, has clearly been in a risk OFF mode.
FCT is confirmation of the risk off mode in sentiment as the SPX made new highs last week, the signals in both HIO and FCT would seem to clearly suggest there has been a bout of selling in to new SPX highs.
FXE (Euro) as mentioned earlier today holding up better than expected.
The $USD on a longer term 15 min chart moving up with the SPX which is an unnatural correlation, in fact 180 degrees opposite of the normal correlation, I think the growth in the $USD is real, the movement in the SPX , manipulated which eventually fails.
The $USD on a very short term 1 min chart turning negative which is supportive of risk assets including stocks, It turned supportive just in time to help out on last Thursday's new SPX record closing high interestingly.
$USD is moving with the SPX today, an unnatural relationship, the $USD's movement today is supportive of the market so I think we will see upside as 3C indicated in the prior post (Futures update).
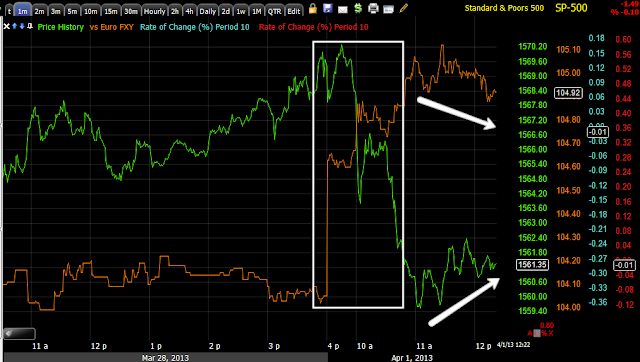
The Yen as a Carry pair, which is part of the CONTEX model, shows the natural relationship of the Yen moving down and the SPX moving up, but where the Yen has had some trouble, most likely due to carry trades being closed as the Yen needs to be purchased to close out the carry, sends the Yen higher or stronger than typical which you can see in the red areas as the SPX has also been effected in the same areas (moving sideways).
The Yen on a 1 min chart jumps up overnight and sends the SPX lower on the open as the negative divergences in pre-market futures suggested and now the Yen is finding a little resistance (support for the market) as futures charts see positive 3C divergences.
Commodities vs the SPX are moving as would be expected intraday, but...
When compared to the $USD (green) we see an unnatural relationship suggesting commodities as well as other risk assets like stocks, the SPX, HYG and Junk credit all see movement to the upside.
Yields have been in line with the flight to safety trade that has been observed in Europe (whether negative yields in 2 year swiss rates or German bunds) as well as the US 10-year yields hitting new recent lows. Here yields diverge from the SPX negatively, this is a red flag for the market longer term as the intraday signals in the market are seeing positive movement. Yields act like a magnet for equities, they eventually revert to yields.
Yields intraday from Thursday to Monday with a positive divergence, supportive of the SPX.
TLT (20+ year treasuries) seeing a 5 min negative divergence recently after solid confirmation in the price trend, this fits well with action in yields today short term.
TLT 5 min with a positive divergence or flight to safety, confirmation and a recent negative divergence again fitting with Yields.
TLT 15 min chart also showing a negative divergence recently.
Relative performance among the main SPX sectors shows a flight to safety in to Healthcare, Staples and Utilities as the SPX is lower early today and almost all risk asset groups are lower except tech, I fully expect this to change with the safe haven sectors underperforming and risk sectors outperforming shortly.


No comments:
Post a Comment