Going in to tonight's Reserve Bank of Australia policy decision as to whether or not to cut the benchmark 3% rate, the $AUD has held gains pretty well today as no rate cut is expected. Apparently expectations for further RBA easing have dropped as economic data has stabilized, one month ago the market was pricing in a 20% chance of a rate cut, recently that has dropped to 8%.
When overseas or European markets see troubled times, there's a safe haven flow in to the $AUD.
The RBA is said to see green-shoots in Housing and the Equity market, but not in too many other places as business recovery has been spotty. Some economists think the RBA will hold rates at 3% this meeting, but expect a .25% (25 basis point) cut at the June meeting and perhaps one more before the end of the year. Others think that after more than a year of dovish policy and rate cuts that Australian homeowners have been busy paying down mortgages and debt; If the RBA decides not to engage in further rate cuts, it will effect fewer people.
For example, the most recent data shows 45.6% of Australians own their homes with no mortgages, this is up from the previous quarter to December when the rate was 40.2%. The historical trend is about 33% of Australians owned their homes outright with no mortgage so after more than a year of rate cuts, homeowners have taken advantage of lower rates to move forward in reducing debt, saving and paying off mortgages.
With the Cash Rate likely to remain unchanged at 3%, traders are looking toward the language for any surprises which would come in the form of any change to the RBA's dovish stance, again not expected because of weak local business conditions and fears of global contagion from Europe.
The strong Aussie has somewhat retarded business investment in Australia, however businesses are becoming leaner and more productive, shedding marginal manufacturing facilities and cutting the work force. Businesses and Homeowners share a similar trend, only 7% of executives are looking for fresh, new financing in the next quarter while 40% are looking to pay down debt.
Much like the F_O_M_C's September decision with the QE3 announcement just before presidential elections, Australia also has Federal elections looming, creating some uncertainty for business as Liberals are expected to sweep the elections; business is unsure of what their policies will be and how it will effect business.
For these reasons among others, the RBA is largely seen as being in a "Wait and see" holding pattern. Again, the main catalyst for surprise would come from any language moving away from the RBA's dovish stance.
The decision will come at 2:30 p.m. local time in Sydney, which is 11:30 p.m. New York (EDT).
Here are the charts I've compiled for the $AUD going in to the RBA policy decision only a few hours away.
First the $AUD Single Currency Futures...
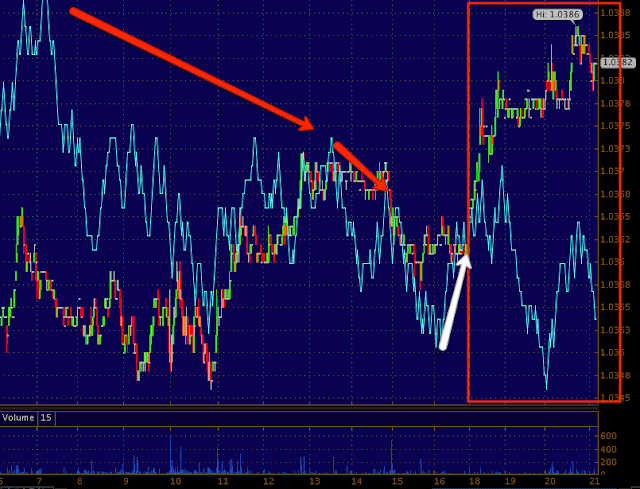
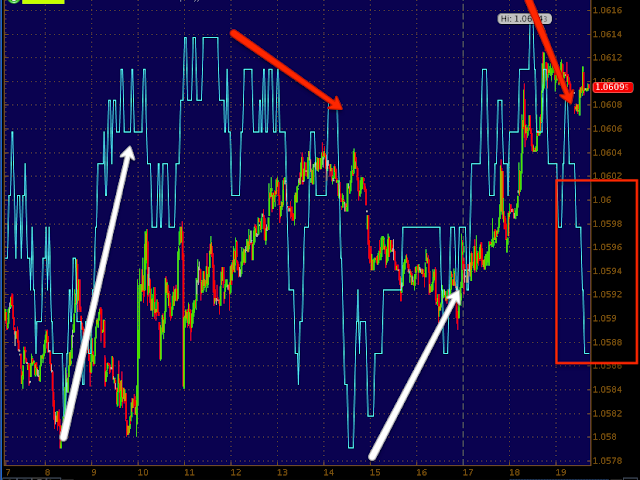
$AUD 1 min is seeing some intraday distribution in to higher prices.
$AUD 5 min chart also has a negative divergence in to higher prices.
So far these are intraday timeframes and generally don't mean much to the bigger picture except that they are only hours before the rate decision.
$AUD 15 min also showing a similar trend of accumulation late last week in to early this week and some negative divergences in to higher prices.
$AUD 30 min is a stronger timeframe, so far there's only positive divergences locally as the negative divergences seen on shorter term charts hasn't been able to migrate to this more important timeframe.
$AUD 60 min also shows the same accumulation that is evident even on the fastest intraday charts, but yet again no hint of a negative divergence here.
$AUD Daily chart shows a different longer term trend with 3C in a leading negative position overall.
$AUD weekly is also showing a larger multi-day leading negative divergence.
So far what we have is the bigger picture showing distribution in to higher prices on longer, more important timeframes of 1-5 days.
Intraday long term charts like 30 and 60 min show more recent positive divergences, even the 15 min which has a current negative divergence is in an overall leading positive position.
The shorter timeframes of 1-5 mins are negative in to higher prices, they are just migrating over to the 15 min chart as well.
AUD/USD 1 min shows some weakness in 3C developing in the $AUD as price moves higher, similar to the single currency $AUD futures in the short timeframes.
EUR/AUD the Euro is showing positive divergences in the Euro/negative the $AUD as the Euro reaches higher ground vs. the AUD. I think this has more to do with Euro strength right now than AUD weakness.
AUD/CAD also shows the AUD seeing some weakness vs the Canadian Dollar as the AUD has moved a bit higher, but roughly in this range.
GBP/AUD, the GBP is showing a lot of 3C strength as it seems to be consolidating near what I believe will be a low, so once again it looks like the AUD will be weaker as most pairs tend to show after earlier strength.
AUD/SGD 1 min The AUD looks weak recently against the Singapore Dollar
AUD/CHF 1 min the AUD looks a bit weak here against the Swiss Franc, but as the chart has developed, this is actually one of the few pairs the AUD looks to be close to inline, there is a slight negative tone to the AUD after earlier strength.
AUD/NZD while this chart looks very sloppy, it actually is quite clear in showing AUD weakness against the NZ Dollar even as the AUD makes runs higher, it seems to be under distribution in to moves to the upside.
AUD/JPY 1 min the AUD is actually leading positive vs the Yen

AUD/JPY 5 min the 5 min chart has developed a bit more and the same trend is quite clear, the AUD is positive in to lower prices vs the JPY as the JPY sees continued upside.
AUD/SEK 1 min the AUD's trend vs the Swedish Krona is one of small divergences sending the AUD higher vs the Krona, but distribution seems to be a clear trend in to any price strength.
In almost every pair above (all 1 min except the vs. the Yen with 1 and 5 min charts) except really the Yen, the AUD looks weak going in to the rate decision, this fits with the AUD single currency future charts on faster intraday timeframes. The mid term timeframes look a little stronger so we'll have to see first how the AUD reacts to the decision, whatever that might be and see if the shorter timeframes continue to migrate against the mid-term ones. If so, the mid term timeframes could link up with the longer term daily+ timeframes and see weakness as a trend.
On the other hand the short term timeframes might just be taking some profits in to higher prices before an uncertain event (Reserve Bank policy). We could see a pullback that is accumulated in the shorter timeframes that links up with mid term timeframes to move the AUD higher. It would be possible to change the longer term charts at that point.
If you have an interest in the AUD as a trading vehicle against another pair, just email me and we'll see what signals develop because so far most of the pairs have shown excellent short term trading signals.


No comments:
Post a Comment