AMZN is looking pretty doggish this morning, we don't want to short weakness, but I think AMZN belongs on your radar. This is an equity short position that I've been waiting to fill out, it's at a profit right now with the first very small block entered around $269, I'd love to see this move higher and allow us an opportunity because I really like this as a longer term short. I don't know how I ended up with 1 call on AMZN, it's only down $10 or so, but I'll leave it in place for now. Even though AMZN looks like a dog, it has the ability to bounce higher and in to underlying weakness which is what I've been waiting for so I'd keep it on your radar.
Here's the chart progression...
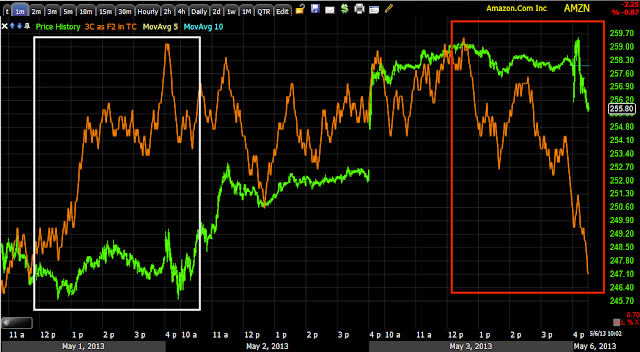
The intraday 1 min chart is leading negative, looks horrible, but it also looks like it may be finding some support in this area. I wonder about the gap, do they really need to fill it now if AMZN is just going to comeback down?
The 5 min chart also shows the accumulation area for that move up that created the gap and a nasty leading negative divergence, this is in the institutional underlying action timeframe so it needs to keep migrating as I'm almost sure it will and infect longer term charts with leading negative divergences, that's when I want to add to AMZN short. Although I like it as a longer term position, you can see how getting in at the right levels (even phasing in) is important, I have room in AMZN to ride out a bounce as the short is at a profit already, this is what enables us to build longer term positions looking to the future and still be able to get away with it without getting knocked around too badly in the short term-in other words, it gives us staying power.
The 15 min chart is interesting because this clearly shows an accumulation zone for a decent bounce, I'd have to think it wants to move toward the congestion area between $270-$280, but this is starting to go negative from it's leading positive position.
If we go even further out to the much more important 60 min chart, the accumulation seen above is not present here, that means it wasn't large enough to register on this timeframe, which tells me AMZN is being set up to sell in to and short in to price strength, thus the underlying weakness. The last negative here was at the last high and it was pretty bad for a 60 min chart so I'm guessing that's where they are trying to build their position.
If the gap does get filled in AMZN, it may be worth a long position just to ride it up, but the important, larger objective is to look at shorting price strength.
Keep this Doggie on your radar, I think it will be worth it.
Is interest rates about to start going up?
-
Yes, I know - it does not make any sense - FED is about to cut
rates...but....real world interest rates are not always what FED wants it
to be.
6 years ago


No comments:
Post a Comment