Before I switched Layouts I just wanted to get the charts out to you so you aren't flying blind.
I also forgot to mention that as TLT made that low below yesterday's after filling today's gap up, there was large volume, then the positive signals started building, this is just an old Wall Street trick for picking up shares without anyone asking questions, if they bought them any other time traders would be chasing them, but they never seem to ask, "Who takes the other side of the trade" when big stops are hit, when we see 3C positive divergences on that stop run, a form of ahead-fake, we know who took the other side - quite ingenious and insightful to the human psyche.
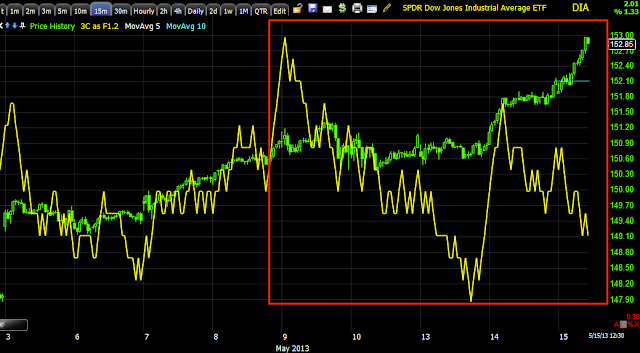
DIA actually looks to be one of the worst when going through the different timeframes.
The IWM and the level I forgot to mention
QQQ has the worst relative performance, everything else is around .50 and Q's at .15, but look out for AAPL. If I were back in my day trading days, I'd take AAPL long here with a stop just below the intraday lows.
SPY
If you want a good read on a reversal point, set up the intraday NYSE TICK chart (1 min), draw a channel around the trend and wait for the break of the channel. It should be soon.
Going to Leading Indicators
Is interest rates about to start going up?
-
Yes, I know - it does not make any sense - FED is about to cut
rates...but....real world interest rates are not always what FED wants it
to be.
6 years ago


No comments:
Post a Comment