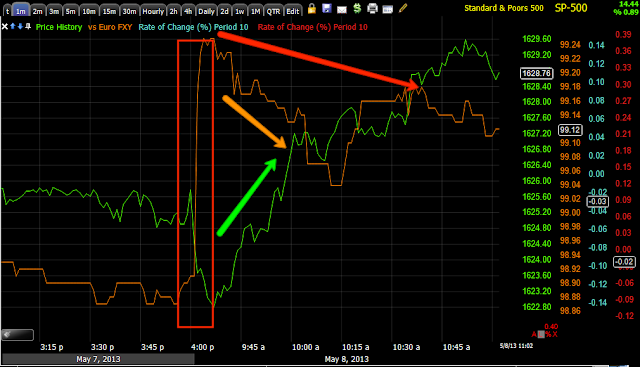
If there are shorts or positions like UVXY you are considering putting on, I would not have any problem right here. The theme is simple, the Dow got millions in free advertising last night, the market was set from pre-open with currencies to give it a goose to take advantage of those limit orders which were likely a few cents above yesterday's close, but since, not good at all. The SPY Arb is just there as a map so you can see the open and what has happened since, look at risk indications on the open and what has happened since.
Positive lever pulling on the open to help the market, since, deterioration which was exactly what I saw as soon as I looked at the first few Leading Indicators as per last post.
TLT's 3C chart
This is a 1 min intraday, the first thing you should note is like I said above, TLT is now reversing from what we saw weeks ago as an obvious (small) distribution area as TLT is up on the day vs the market-this is not normal, this is real demand for safety as shown last night in an almost panic mode, distribution was not nearly enough to doubt the flight to safety flow, but enough for me to say back then when TLT was near or at local highs, "TLT should pullback any time at least to the gap". As discussed last night, this "perceived weakness" in TLT sends Arbitrage algos on a buying spree, they are programs, not independent thinkers, the $USD down means, stocks are cheap=BUY, TLT down means smart money is moving in to risk and out of safety=BUY, however looking back (we never know what the real plan is when we see what they are doing, but if we follow the signals, by the time we find out, we made money), this was all just a short term maneuver to get the SPX and then DOW to new highs, retail didn't seem to follow as I think they expected.
In any case, the intraday signal suggests a consolidation, 1 min negative, but...
Not a 2 min negative which would mean a pullback.
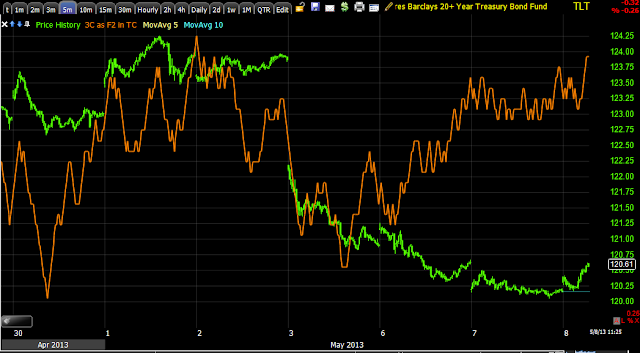
The overall trend for today in TLT is even higher on the 5 min chart and others.
VXX- Also has disproportionate a scale on the open with a much stronger move to protection in VIX futures vs the move down in the SPX, you can see clearly how disproportionate they are. Even though VXX is not as high as it was at the open due to the SPX moving up from there, VXX is moving up against all natural correlation which confirms yesterday's charts and overall for a while, that there's real demand here for protection, it should not be rising with the SPX, this is market negative and shows smart money is moving quickly for protection as seen in last night's post VERY CLEARLY.
VXX is also higher today, this is not a normal correlation and again confirms the 3C charts I featured last night showing an almost panic to move to protection (VXX/VIX Futures) and Safe assets (TLT/Treasuries).
3C 1 min is in line so I don't see a big pullback as of now, just some lateral-consolidation trade for a bit, but not too long before it moves higher.
The 5 min chart is beautiful, but what is important is it is already registering a new leading high today meaning VXX is seeing real demand, real accumulation and even in to higher prices, this is kind of like the AAPL panic in a way that dropped AAPL 45% and 315 points.
HYG was used to goose the market, a lever of manipulation on the open, they needed to do something to offset all of the other negatives they couldn't control due to real demand, however it is failing now.
Here's the goose set up for HYG on the open which is seen above as green on the SPY arbitrage, you'll see below why it was used and what it had to counter on the negative side.
Other than that, nothing has changed, in fact overall, after the initial small positive divergence (only 1 min chart and a small divergence) we see even stronger distribution in HYG today, I.E.
The 2 min chart give NO SUPPORT WHATSOEVER TO THE 1 MIN POSITIVE ABOVE, in fact the overall position is worse.
The 5 min chart needs no drawing, the divergence should be very clear and the real trouble...
The 15 min chart with an extremely sharp leading negative divergence for this timeframe. This is panic to get out of Dodge on risk assets and in to safety.
Yields are like a magnet for equity prices, normally they should move together with the SPX, first they stopped making higher highs, then they are in a sharp decline today, this is also due in large part to the flight to safety in Treasuries, the higher Treasury prices go, the lower yields go.
Commodities also gave early strength and seem to be goosed, although this may just be a reaction to the $USD's open, in any case they are falling off as well.
In currencies, the $AUD's intraday relative strength is fading fast, for the week it is severely dislocated, for the year, it's just about as bad as I have seen, this has in the past been one of the best leading indicators of currencies, the Euro tends to be a better confirmation currency. Speaking of which, the Euro is also fading on relative strength v. the SPX. The $USD from yesterday's close gave the market an early shot in the arm on the open, but intraday it is flattening out, if the 3C EUR/USD charts are correct as well as the $USDX single currency (Dollar Index), then the $USD should head higher soon, this is bad for stocks and commodities, oil should be interesting so I'll look at that as well. The Yen kind was stronger on the open, which kind of mitigated the $USD weakness on the open, intraday it has made a lower low, which is increasingly having a stronger and stronger pull on the market, to the point in which I'd almost say we went from the Euro to the AUD and now to the Yen as far as currencies that are important to market direction. Here's a look, I'll check Yen single currency futures, but we already saw EUR/JPY with a negative divergence suggesting the Yen move higher which hurts the market, the Yen and SPX have topped and bottomed at almost exactly the same minute for at least a week now.
Look at the Yen's early strength on the open and exactly coinciding with the SPX's early weakness and then the early reversal, the Yen is making a lower low intraday here allowing the SPX a higher high, but I think the Yen will change soon.
I looked at the Yen single currency future and can't get any solid signal there, although we know how the longer term trend is going.
Back to the Euro for a hint...
A negative divergence so this in part explains...
The leading negative in the EUR/JPY, which is Euro down relative to JPY and is a market negative event, it seems the pair has given the market all the strength it can for now and the market didn't do much with it.


No comments:
Post a Comment