Well it didn't take long for that fairly large imbalance between the CONTEXT ES model and CONTEXT to catch down to each other, all it took was an article from the FT's Harding that Bernie would signal that the taper is near on Wednesday, as if we all didn't already know that, they've essentially already told us. However, this story hitting the wires sent futures down to the model.

Then Harding posts doubt about his own piece on a blog, the market reaction?

Guess what? In the near term, the market is still pretty opaque. I hate to try to predict what the F_O_M_C may or may not do tomorrow, but it is still the Yen and $USD single currency charts that seem to suggest a very strong move this week, once again...


However, just like last night, the near term charts like 1 and 5 min are completely useless, just in line.
As you know, I closed two HYG calls for a loss on a 1-5 min negative divergence, this works against the market and I opened an HYG put position, however like most of the market, HYG saw some late day positive divergences, the question is whether they hold. For now, I'll keep the HYG put in place a I think it has a little more downside to go even with accumulation continuing.
Volatility is even opaque, I don't have much short term on VXX or UVXY, the only thing I find is a positive in XIV which would be a positive for the market if price follows the divergence.
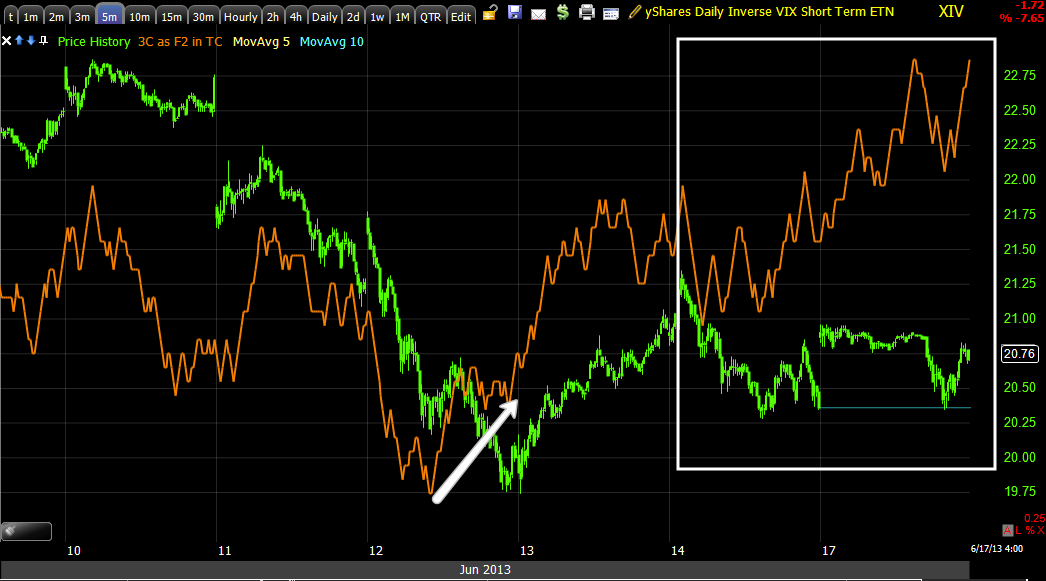
To make things even more confusing, the 3 min TLT chart that built all day today basically contradicts the XIV chart above, unless the correlation is about ready to break as big money flocks in to safe haven assets.

This is what I mean by the short term is opaque, it's usually best to just wait it out until signals become clear again.
Right now the Index futures aren't very useful.
Moving to Leading Indicators...
Our risk sentiment indicators are either in line or not telling us anything clear. HYG Credit is relatively underperforming the SPX, I have the put there, but I think HYG will NEED to shape up to some degree before the market can make any serious move higher. The AUD basically gave out any upside support near term today, the Euro however rallied a bit in to the close, still not earth shattering signs.
If I had to go by DHY alone, which is very illiquid High Yield Credit, I'd say this is a bearish reading near term.

Yields did rise a bit on weaker bond activity today, they tend to drag equity prices to them, but this is still no smoking gun.

Yields higher than the SPX, not by a whole lot though.
Commodities may be a hint, they showed excellent relative strength today...


I know it's not much, beyond that, the only probability I see based on market behavior is some repair work needs to be done with the SPY and IWM 5 min charts looking like this.


This generally means some pullbacks or consolidations allowing 3C to build.
We still have this pattern in the market...


I don't have too much more, there is this VIX sell signal, which would mean the market moves the opposite, to the upside.

I'm afraid that for the very near term we have no better visibility tonight than we did last night in the very near term, that can change real fast, but until it does, I still urge patience until we get a clear signal from the market, the signals drop off every once in a while, but they always come back.
If anything pops up in futures tonight, I'll be sure to share it with you ASAP, for now, pretty quiet .
As for the Nikkei, if I HAD to guess, I'd say they see a little downside, they have a weaker 15 min chart and in line 1 and 5 min charts, but the night is still young.
Patience is a tool, it is a skill and it's a lesson most of us need to learn and re-learn. IF THERE'S NO EDGE, THERE'S NO POINT IN RISKING CAPITAL.


No comments:
Post a Comment