This should give perspective to the EUR/JPY 1 min and some of the other averages confirming in the short timeframe, I'd say similar to a closing ramp.
First in Context for ES and in the SPY arbitrage, there are very few signs right now for much of anything, there doesn't seem to be any manipulation of any kind.
As you can see, the CONTEXT / ES model is pretty flat, I'd call this a non-issue.
The same with the SPY Arbitrage, I don't think there's any manipulation to any great degree here.
Looking at VXX, which is VIX short term futures, which trade opposite the SPX/Market, their 2 min intraday chart looks ready to take off.
However since this capture, there has been a slight 1 min intraday negative, again, like the USD/JPY chart, suggesting near term upside in to the afternoon, some of which we are seeing now with the SPX back above yesterday's close.
The longer 3 min chart has seen migration of the divergence which is good and is leading positive also suggesting it is about ready to take off as well, since capturing this chart, it too has shown a smaller intraday negative divergence that fits with the others described earlier.
The 5 min chart has migration of the divergence making it more reliable as a signal, yet this chart remains positive, in fact even more so than at time of capture. This suggests to me that as the EUR/USD update showed, the move to the upside intraday is just that, as this more important timeframe remains positive.
The original set up or bear trap (discussed in more detail in last night's post) shows the expected, but failed breakout to the upside, it never materialized, sending traders to the short side, the first test of resistance and failure would get retail traders going short, especially as price moved lower the next day.
Today's move actually worked out better than I expected, it did break above resistance and then failed giving traders even more confidence that there's no demand, since we had a move like that today there's no reason the market shouldn't head lower this last hour, that's why I'm puzzled over the 1 min positive I have been positing about.
The SPY 5 min is where the highest probabilities are for the short term move and they are solidly negative.
The 15 min is solidly positive which confirms my expectations of a move down to bring in the shorts and then slam the door shut on them by initiating a short squeeze, ultimately sending the market much higher, but again this is just another set up for an even bigger move to the downside as explained last night.
One of the things that confirmed this for me today is the accumulation of HYG which is HY Credit and one of Institutional money's first choices to express a long position.
Here the 1 min HYG chart shows accumulation in to a flat environment
The 2 min chart has migration and a nice leading positive divergence, no matter how ugly the SPY's downside could get, it's clear smart money is preparing for a nice move to the upside.
The HYG 5 min chart...
A close up of the same chart, again smart money is preparing for a significant move higher, via a short squeeze.
The 10 min chart shows the first positive divergence in this trend.
As does the HYG 15 min chart, just like the SPY 15 min.
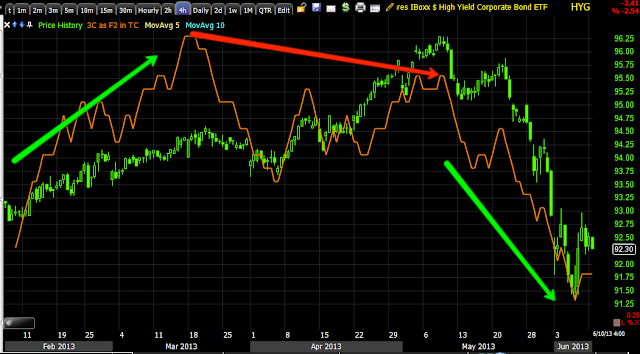
Longer term HYG is in no place to sustain any kind of upside move, as I said earlier, it's just a means to another set up and a means to a downside end of large proportions.
As far as risk sentiment goes, FCT shows risk off as I'd expect.
HIO shows the same.
As do commodities.
This is the QQQ 1 min positive that fits with the USD/JPY 1 min positive, even though it is well within a much larger negative divergence.
QQQ 3 min leading negative is the main divergence and highest probability on this chart, but the intraday chart still shows the high probability of an intraday move higher.
I just don't understand why it would be needed at this point.
Here's the IWM 2 min leading positive over all with a smaller intraday positive.
Perhaps I'm making a mountain out of a mole hill, but I don't like surprises so I have to keep track of all of this.
I bring this to your attention just so you know where we are in case I have to put out some charts that seem way out of place, I doubt it, but I don't want you in the dark.
I'm going to do some more checking, it seems some of these intraday positives are starting to break down so perhaps this has been a move to peg the averages in place for a few hours for whatever reason.
Is interest rates about to start going up?
-
Yes, I know - it does not make any sense - FED is about to cut
rates...but....real world interest rates are not always what FED wants it
to be.
6 years ago


No comments:
Post a Comment