At the $2.07 fill, the P/L for the USO July $132.50 calls comes to a gain of + 27%
(I will likely stick with the bulk of positions entered for this move, but I really want to start clearing out these shorter term positions and put more of my attention to the prize, that means spending more time on the core positions for the highest probability trend, which should follow the upside trend we are playing the last week or so (the one I have described as us "hitch-hiking on" and it being a means to an end).
USO 15 min is a PERFECT example of a head fake move, there's clear resistance, USO is run above that resistance forcing weak shorts to cover, pulling in some longs and this was the last thing to happen before USO reversed to the downside from an otherwise rangebound lateral trend, this is a great example of a head fake move.
The 15 min chart doesn't look great so if I were to consider opening a new call, I'd have to have something just unbelievable considering the chart and my focus.
USO 5 min moving from up trend confirmation (green arrow to the left) to a perfect example of a leading negative divergence in the red box, even price is a good example of a flat area where the divergence developed. Next in white a leading positive divergence, it's about two days so it's not going to support a large upside move, all of these indications are hints of what to expect, the size of the divergence, the longer 15 min chart, the length of the divergence or reversal process, etc.
Finally we have an in line/confirmation move up right now, but as you know, any new divergence like distribution of this trend, will start at the earliest / fastest charts and if strong enough, migrate across longer timeframes.
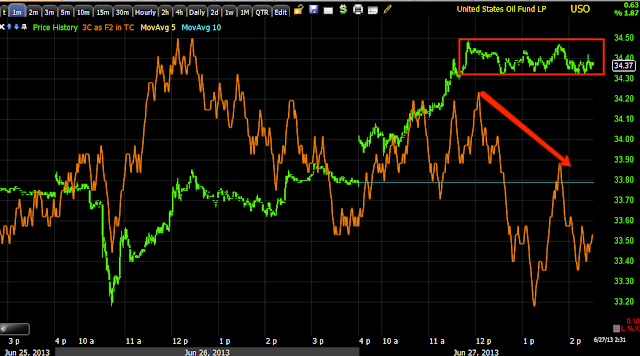
This is the 1 min, the earliest, fastest 3C chart, clearly leading negative intraday with a flat range that helps confirm the divergence.
That 1 min chart has some strength as it has migrated to the next timeframe at 2 mins, again before this we had confirmation with 3C and price, then a flat range and a distribution signal. I see no reason to hold an asset with as much leverage as an options with time decay as well at this point.
Finally the 3 min shows the positive divergence, note it isn't that big, it isn't leading, the uptrend is about what you'd expect for the size of the accumulation. We have confirmation at the green arrow and now migration of the negative divergence to the 3 min chart. AS or if this gets stronger, it will move to the 5 min chart next.


No comments:
Post a Comment