Financials have looked similar to the SPX since late last week, really not much has changed.
I'll show you the charts, my ideas for playing this and ideas that I won't use, but still like.
1 min went positive at yesterday's lows, in fact quite a bit before as this Call position was opened yesterday around 2 p.m.
The 1-3 min charts on the SPY and most other averages are negative for a pullback, they are positive on inverse trading instruments like VXX/UVXY, FAZ, etc.
I'd consider playing XLF $20 puts here, but I think it's very speculative and you need to be on top of it. Otherwise a quick long trade in FAZ (3x short financials) would also work assuming we haven't had a big move b the time this gets out..
The 5 min XLF trend showing confirmation on the rally to the far left, distribution at top #1 and heavier distribution at top #2 as we's expect to see, but look at the change in trend recently.
This is a close up of the 5 min chart above, it remains quite positive.
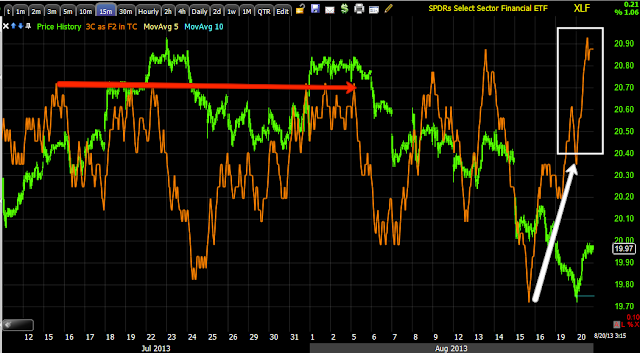
This is the 15 min chart, I've rarely seen a 15 min chart with such a quick and large lightening bolt divergence in virtually a day, the size is enormous, so it seems like there was buying in to higher prices so whatever set this off must be important and all I can think of is the minutes.
However, I want to use that upside strength to short financials. This 4 hour chart is everywhere, this is like the F_E_D, don't fight it.
You could use FAS (3x long Financials) for a bounce, I'd prefer to see a pullback near the $19.75-$19.80 range (XLF) before entering any more long.
You can use FAZ 3x short Financials as the bounce ends and you need a quick short on Financials although we'll be covering GS, JPM and others.
Is interest rates about to start going up?
-
Yes, I know - it does not make any sense - FED is about to cut
rates...but....real world interest rates are not always what FED wants it
to be.
6 years ago


No comments:
Post a Comment