While I've still got currencies on the brain, in tonight's post,
Currency Update: EUR/JPY in which I showed how the EUR/JPY not only lifted the market overnight from Sunday night or actually early Monday morning through the close, but it just needed to get the market to some obvious technical levels that would cause a short squeeze. Interestingly the market followed the pair again today. More importantly I showed how this former Carry pair was not looking good at all and the chances that the pair would be taking the market much higher were fading rapidly with building negative divgerences in the pair and positive in the JPY which all carry trades use as the second currency in the cross.
I made mention that the market wouldn't get support for much longer (if at all) from the pair "unless another pair stepped in to take its place". These carry pairs use to hold a solid uptrend for 4-5 months, now maybe a day or two.
I looked over the other contenders, the $AUD and $USD and besides the Yen getting stronger making any carry pair difficult, noether the AUD or the $USD have any underlying strength at all so I think it's pretty doubtful the market gets any support from that old standbye market manipulation trick.
Even though I think a lot of the upside (by the way the NDX made the highest close since Nov. 2000 today) is the unraveling of war premia, this is also the same "Very strong move to the upside" that we had expected, the pullback to the lower end of the range was only to make the range stronger for a stronger upside move.
I think there's very little doubt that this is directly attributed to Syria and the change in tone from war-footing to a diplomatic face-saving way out as Obama doesn't have the support in Congress (it is unclear whether he would have went ahead or still will without their approval as he said he feels he has the power to do this without Congress when he said he'd ask for a vote there).
Syria is a
catalyst at least or an excuse, maybe not the reason as the cycle was set up before Syria became the issue it is.
The wholesale dumping of oil (USO - WTI) in green shouldn't behave that way considering what the $USD did since Friday's close, note the $USD (orange) lost a lot of ground since Friday's close, since oil is dollar denominated, a lower dollar means oil prices have to rise just to make the same money on a barrel, the only way it falls like this at this particular time is a discounting of war premium, but still I don't think that's all because the market needed a sponsor, the EUR/JPY.
Now that the market can't get the help it needs to maintain the "Strong move up" and the additional time to distribute up here, the market needs something else, what is there?
Well as I was looking at closing charts I came across this, you'll probably recall it...
TLT-20+ year Treasuries vs the SPX, note the close though, TLT saw a sharp move down and the SPX a small move up.
This isn't exactly banging the close and there may be a hint in the inability to "bang the close.
Here we have short term VIX Futures (VXX), notice anything unusual here near the close?
VXX was also pushed lower in to the close obviously in hopes of banging the close, the move in the market at the close wasn't organic, the Q's were starting to struggle because of AAPL, and every other index, no matter how broken their correlation has been (today not as bad as other days, but the NDX at a new high closing about half of the IWM and the NDX closed with a nice downside reversal candle.) all looked almost exactly the same the last few minutes,
considering they were trying to bang the close, it was a pretty half hearted attempt by the market itself.
What other evidence is there that they were trying to bang the close?
Take a look at HYG during the close.
So we have TLT and VXX down right in to the closing 30 mins or so and HYG up,
anyone remember what that correlation creates?
THAT'S RIGHT, THE SPY ARBITRAGE
And in case my charts above weren't enough, here's the Capital Context SPY Arb. model which is based on only 3 assets, the flight to safety TLT, the flight to protection VXX and the Risk on HYG, the first two have to be down and the last has to be up to create the arbitrage and there it is spiked at the close, BUT THE MARKET COULDN'T DO MUCH WITH IT.
BEING THE EUR/JPY CHARTS (AS WELL AS THE OTHER POSSIBLE CARRY CROSSES) LOOK THE WAY IT /THEY DO, THE ONLY OTHER SHORT TERM MANIPULATION IS THE SPPY ARB.
Don't get me wrong, I'd like the market to stay up here and move laterally or slightly up for a good week or so, this was the main trade, the main point in all of the cycles, to sell short in to a strong market rally, that was the gift, that was and is the set up for the primary downtrend.
However, I'm not sure how long it can or will hold and obviously the unknown of Syria plays a big role.
As far as some other assets and indications...
You saw GDX, I love it and I think it moves, I'll show you some interesting GLD/Silver charts developing tonight in another post, but GDX has a tight correlation with gold so if gold moves up with GDX, it would almost certainly be out of a "Flight to Safety" trade.
How about some market breadth/internals?
These are breadth indicators, the indicator is in green and the comparison symbol in red (usually the SPX unless otherwise noted).
The % of all NYSE stocks trading above their 40-day moving average, as you can see this has gone from 85% to 46%, that means the majority of all stocks in the NYSE are below their 40-day moving average despite the NASDAQ at new highs and the other averages close!
This is the same indicator, just
1 standard deviation above their 40-day moving average, these are momentum stocks typically. We have a move in breadth down from 70% of all NYSE stocks to a current 30%, note the sharp uptick recently, that to me says, "Short Squeeze", especially in a 1 SD > 40 ma indicator, but the 30% level even on a short squeeze is an extremely thin, hollow market.
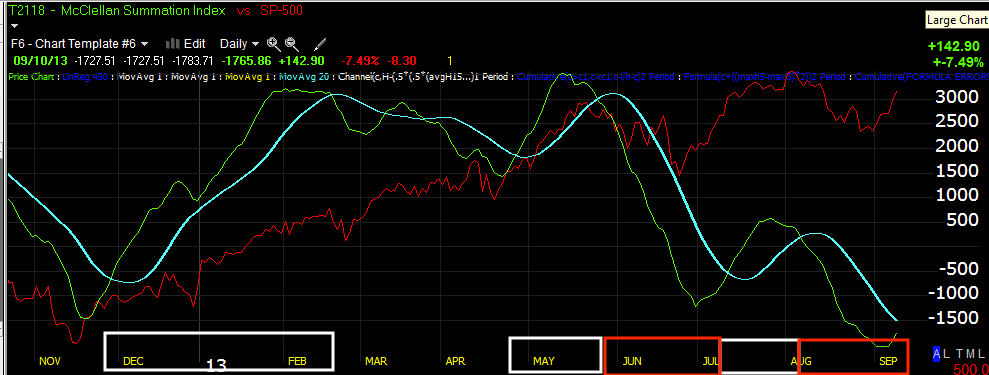
This is the McClellan Summation Index, a cumulative indicator of the MCO, it should move with the market making higher highs and higher lows in an uptrend, but look at the decline from May. Crossovers or cross-unders at the zero line are also signals trend traders use, right now it would be signaling a short trend or bear trend, the breadth of the market is horrible,
as I say, "Price is above all, deceptive"
Trend Traders use the same indicator with a 20 day moving average to signal long/short entries/exits, but the breadth has been so bad that many signals were short as the market was rising,
this isn't a faulty indicator, breadth indicators are based on real, hard , objective evidence, not interpretation, the new lows just shows how bad this market is as many averages are so close to new highs.
This is the R2K's Advance/Decline line, there's only been 1 other time on the chart that the line fell behind and not for long, right now the R2K may be performing, but the majority of stocks are much weaker than price lets on, this is what leads to 2 or 3 months of gains being wiped out in one opening gap down, you must pay attention to these warning signals.
Street sentiment via HIO shows positive sentiment as the base was being accumulated, it wanted or did pullback where the market should have, since then sentiment has been down.
Here's the intraday sentiment, they weren't buying the EOD attempt to ramp the close.
Junk Credit wasn't buying it either, even though it trades just like HYG, the only reason HYG bought it was because the SPY arbitrage wouldn't have worked without HYG.
And yields that act as a magnet for the market giving leading signals here are now giving a leading negative signal.
I have a lot of other interesting charts,
but the real question is, does the market make a shallow pullback before large scale distribution or does it go ahead and start now or do we get something else entirely with Syria causing uncertainty?
I'm initially thinking, "Sell the news", kind of like AAPL today.
More to come after dinner.


No comments:
Post a Comment