First it looks like the MOST SHORTED Russell 3000 (Custom Index) did see the predicted opening squeeze and looks to be continuing the start of the end of the squeeze seen late yesterday with the first lower low of the afternoon and first clearly negative 3C divergence, the squeeze this morning on the open was short lived.

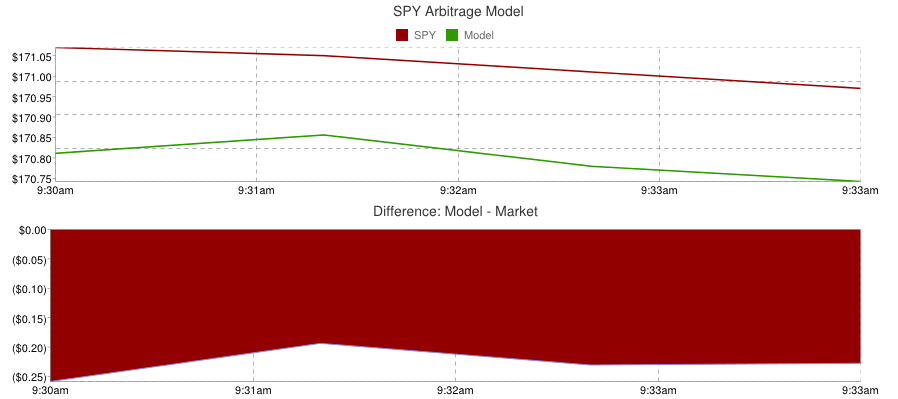
The most shorted R3K names (red) vs the Russell 3000 (green) saw an initial opening burst higher that failed quickly, the short squeeze was what drove afternoon trade higher in Russell indices, SPY arbitrage drove it higher to the squeeze in the a.m. yesterday, both are waning.


The 2 min chart of the IWM has quickly fallen in line with the 1 min in going negative, so this may turn around quickly. I'd be patient, wait for stronger signals and typically they'll come in some sort of range so there's still a chance to get a good entry with good confirming signals.
You never have to take a trade, sometimes sitting on the sidelines is the best course until a trade shouts and jumps off the chart.
It appears the tactics of short term manipulation are either no longer needed or exhausted.

CONTEXT for ES futures is still at -85 negative ES points, a huge dislocation that is twice the size of anything I've seen in a year.


A quick updated look reveals some more downside to -500, but this is still for all intents and purposes, FLAT.
 My Custom TICK Indicator v. the SPY, you can see the negative activity Monday, the more positive yesterday and today's nearly flat in yellow, very odd, from very negative, to pretty positive to totally flat, I'd expect flat yesterday at the EOD, although yesterday's TICK data was not impressive in any way.
So far it "seems" like there is little movement or the market is trying to hide movement for those following internals, we will see what the 3C charts say shortly about that.


No comments:
Post a Comment