It's been a good week or so that I've thought gold looks really good as well as miners, but it's too gappy and has some pulling back to do.
Keep in mind gold is very QE sensitive, but my gut feel based on the size of the base and long term positive divegrence, whatever occurs tomorrow will pass as this base is large enough that any changes in QE must have been discounted.
I also recently decided that core positions would stay long, I only have 1 which is a NUGT long, I closed the GDX Call that was expiring for a loss of about 9%, which I was fine with considering it was down over 75% at one point.
I don't mind trading positions and DUST may be something you might be interested in as gold/GDX look to pullback, D?UST would move up as a 3x short gold miners ETF, I haven't made that decision, but will consider it.
I have laid out two scenarios for a pullback in gold, the first would be the typical "Constructive pullback. This is a pullback that sees accumulation as it moves lower and we know smart money is buying it on the cheap, this doesn't happen immediately, gold has to discount a bit first.
The second scenario is a larger base which would be a deeper pullback, but it would also probably upgrade the trend in my view from sub-intermediate/intermediate uptrend to Intermediate/Primary uptrend, a larger, stronger base can support a larger, stronger move. Well have an idea of which it will be as gaps start to get filled and where we see accumulation first present,
I have little doubt there will be accumulation at one of the two areas based on what's already in place.
Most of the analysis is centered on Gold, but GDX (miners) have had a tight correlation with gold and have similar long term signals.
This is the correlation between the SPX (SPY) green vs gold in red, it has behaved more like a risk asset than a flight to safety, but gold's true demand is on inflation
expectations.
The daily chart of GLLD shows a smaller gap that is a possible target and a larger gap below that.
Before HFT's became so dominant, I'd call the larger gap a break-away gap (bullish) and would not expect it to be filled, but the last several years the market has been ruthless about filling gaps which is a shame because breakaway and exhaustion gaps were very useful and gap support and resistance use to be some of the strongest I'd ever seen.
The 60 min X-Over Chart shows what is VERY close to a cross-over (this is the pullback stage envisioned) . I drew some red choppy lines as it wouldn't surprise me if intraday GLD loitered in the area and popped above and below those lines a few times, but this is the reason for the X-Over system, to reduce noise and false or whip saw moving average signals, I have little doubt we'll see a pullback.
Again, as for tomorrow being gold is so QE sensitive, if anything throws gold of course because of the policy statement, I'd say probabilities are very high it would pass and be transitory in nature, especially with regard to the longer bullish base/trend developing.
The longer term multi-day 3C chart shows the 2011 top we had called and the primary downtrend we had called in 2011 that followed, however the current positive divegrence may not look very large in contrast to other signals, but keep in mind this is a multi-day chart so it's a very strong signal.
This is the daily chart for Gold (YG) Futures, again, a very strong leading positive signal.
However on a 30 min chart we have the kind of signals that I've been telling you and showing you in expectations of a pullback to fill in some of the gaps.
GLD's 30 min chart should be clear as to the bias
And the 15 min chart should be clear as to the high probability of a pullback. Because charts from 30 min to 2-days are very positive it makes the probabilities of accumulation during a pullback VERY high.
This is the 1 min GLD chart with an intraday positive divegrence, just like the market intraday, I wouldn't be surprised to see GLD bounce around the area, I call it loitering, it's short term noise within a trend common at a reversal pivot.
The slightly longer 3 min chart though shows you where even the intraday probabilities lie.
This is a 2 hour chart of GDX (Gold Miners), they have very similar signals to Gold, in fact I'd treat miners and gold pretty much as 1 trade for risk management purposes being they are so tightly correlated.
If you look at the positive divegrence area closely and price, you can see a large "W" base.
This is the short term 5 min GDX chart (compared to a 2 hour) and the accumulation launching the last move up, confirmation and the negative signal for a pullback.
This is NUGT, the 3x leveraged long of GDX, it too has a very strong positive divgerence and the dates in the white box form a "W" bottom, this is one reason I have some doubt as to Gold going all the way down to form a larger base, but in either case for longer term trending positions I don't think you can lose.
I think both GDX (or NUGT) and GLD will make EXCELLENT longs as soon as we see short term charts accumulating again.
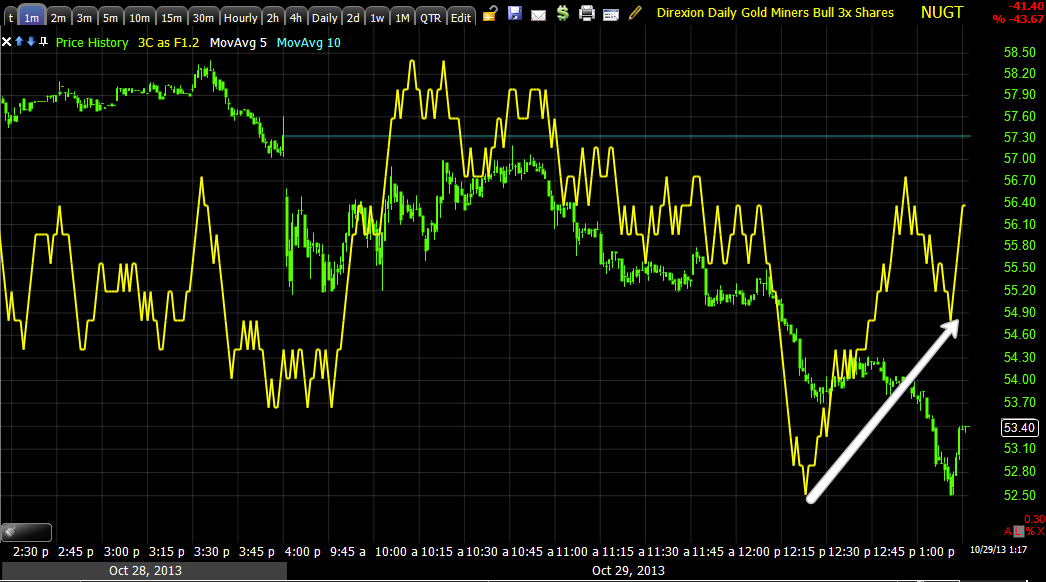
This is the 1 min chart of NUGT, again just to show there's some probability of bouncing around the pivot, it's just noise, but if it does bounce and you want to play DUST long on a GDX/NUGT pullback, then that bounce would be a tactical advantage on a DUST entry at a lower price with lower risk.
And again the slightly longer intraday chart shows where the near term probabilities lie, a pullback.


No comments:
Post a Comment