There are a lot of things that go in to this analysis, I'm going to show you as much as I can in one post, but trying to fit too much in is difficult because things change so quickly intraday, however by and large considering the bond market is closed, the volatility today has been almost non-exisitinet, I think most would have expected quite a ramp by now so this may very well be in line with the weakness we saw developing Friday as posted Friday and over the weekend as well.
This isn't to say I don't think we won't see some upside volatility, intraday we have a lot of right triangles and they'll bust out one way or the other, I'm guessing up on a false breakout, which is a serious scenario I considered last night if Friday wasn't about an op[-ex pin which is my least likely probability.
HYG overall is looking ugly and it is a major supporting asset for the market, but intraday there seems to be some improvement and the Most Shorted Index for the R3K is also showing some improvement, VIX action is not worth commenting on, pretty dull.
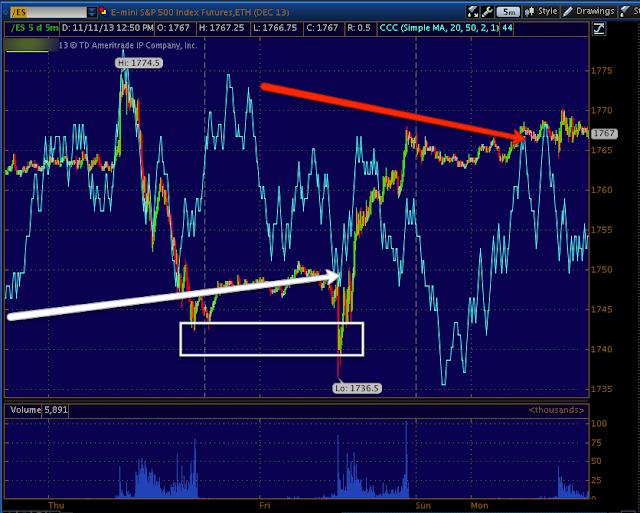
First the Index Futures because they were showing 5 min positives on Thursday leading in to Friday's upside. There was some weakness developing in those as of late Friday and here's where we are right now.
ES showing the positive on Thursday and Friday morning after the jobs report and the market knee jerk to the downside, but also a relative negative in SPX futures now.
TF 5 min (Russell 2000 Futures) with the same 5 min positive Thursday in to Friday's lows after the jobs report and a leading negative divegrence so there's deterioration in one of the initial signals that told us Thursday a move up Friday was likely.
SPY 1 min intraday is a bit leading negative, but there's a small intraday positive developing, I suspect it has to do with the intraday triangle getting tight in to an apex.
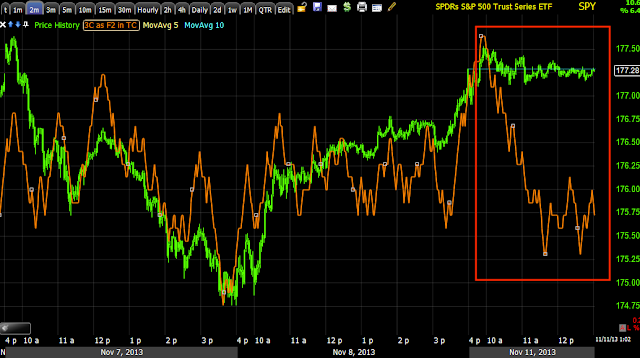
The longer 2 min chart just shows the leading negative for the day, no positive activity has been strong enough to migrate to the longer/stronger underlying chart. The triangle today is obvious and it's mature/tight.
SPY 3 min is also leading negative, The positive in to Friday's post jobs report lows are visible as accumulation, it seems that's being unwound.
IWM 1 min actually looks to be seeing some of the worst underlying trade just like R2K futures above
The 2 min chart is migrating the weakness to a leading negative divegrence as well.
And the 3 min chart showing the clear accumulation area for the move Friday and a clear leading negative divegrence seeming to unwind what I called on Thursday, "A Mini cycle". I thought it might look something like a Falling 3 Methods candlestick pattern in size and duration.
Q's intraday have some of the better looking underlying charts as you see a positive, then in line/confirmation and only a small relative negative today.
QQQ 10 min gives a larger view of the "Mini cycle, I'd guess from the accumulation period, that the Q's could and should be able to move up a bit more, but don't get me wrong, this is still a very small accumulation period and thus "Mini-cycle" seems to be an appropriate term.
NYSE TICK intraday on my custom indicator shows intraday breadth falling off as we are drifting laterally, again I don't think this can or will hold like this the rest of the day, any movement would be useful in determining what is happening, I suspect any upside movement will be distributed as the trends have been heading that way, but I want to see confirmation always.
This is HYG which has been used extensively to support and manipulate the market higher, last week they started a new accumulation phase in white and the reversal process was about half done before it was abandoned with distribution killing the reversal process and sending HYG lower as seen in credit charts last night, there is a small intraday positive which fits with my view of intraday action, but the larger negative position also fits with the larger view of what we saw late Friday and over the weekend and thus far today.
This is a close up of the HYG intraday positive, not too large, but enough for an intraday move.
And the larger, more important HYG trend on a 15 min chart clearly leading negative
The R3K Most Shorted Index has improved substantially over this morning, maybe a short squeeze to break this triangle?
This is an intraday negative in the EUR/JPY, as you know ES has been tracking the carry trades so this would not be helpful for the market.
This is ES in purple with the EUR/JPY, you can see how no movement in the carry is slowing down the market.
And...
It looks like the Yen is seeing an intraday positive divegrence, this would effect all the carry trades negatively if the Yen bounces from the positive divegrence and put downside pressure on the market.
Is interest rates about to start going up?
-
Yes, I know - it does not make any sense - FED is about to cut
rates...but....real world interest rates are not always what FED wants it
to be.
6 years ago


No comments:
Post a Comment