Everyone who knows me knows NOT to call me during market hours, however since Anna has been in the hospital, everyone I know has been calling so I'll have to put a message with an update and leave it at that (she's still waiting for a doctor to see her since she was admitted last night for those of you who have asked for an update, and she's feeling better as she's been on oxygen-thanks for the kind emails as always-you all are truly the best I could imagine).
I've been trying to get two updates out, one is Leading Indicators and it covers not just intraday, but the current cycle and then the longer term which can be from 2009 lows to this year with the key reversal day on May 22nd and show leading indicators have gone to "pot" since.
I think this is important for you to see so you may weigh the larger probabilities vs the shorter term probabilities and make decisions about whether to be engaged in new trades in this area or whether to sit back and wait for it to clear up.
High Yield Corporate Credit is one however (short term), that I am watching carefully as it has a strong effect on the market, usually fairly short term, but it's been used more and more as volume and real demand/supply and Fear/Greed dynamics fade and the market becomes more about which carry trade can be activated, which arbitrage trade can be activated, etc. This is really a market in which most of the traditional market movers do NOT apply and the market movers that use to be used much more sparingly, the manipulative ones are really taking over.
So here we go....
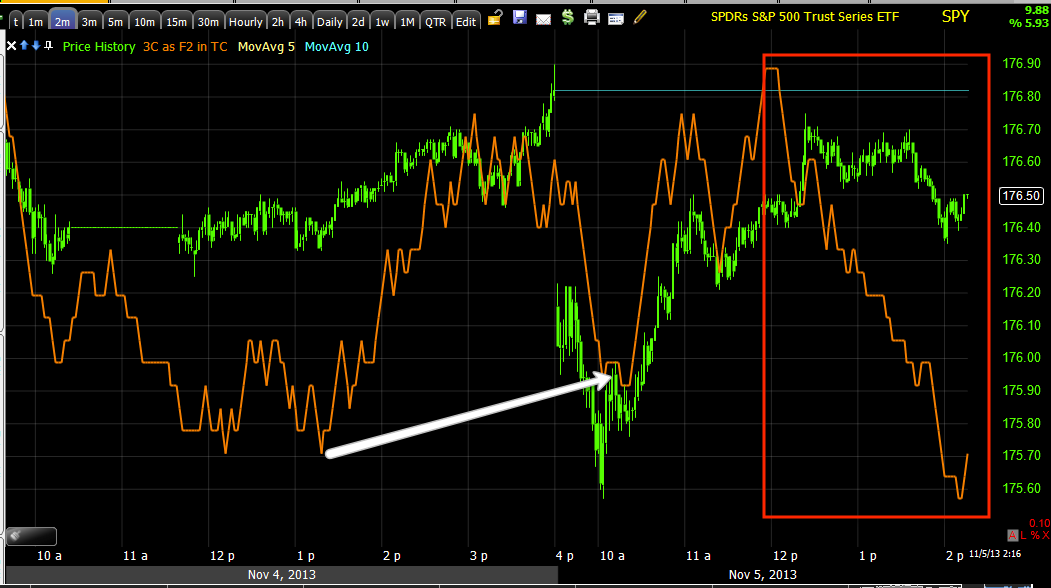
This is a 15 min chart of the SPY, in yellow is the "Chop", this
is truly a meat grinder for a portfolio and for most trades as their greatest directional influence is the market and then their industry groups, which is why I want to cover what I call the "3 Pillars", they are the 3 industry groups that virtually need to be on board for a rally/bounce to stick.
"If" the chop zone was wider, it would be a great 3C trading zone as 3C does a fantastic job in these zones, but it's just too tight for me, too little profit potential and too much risk.
SPY
I said it earlier this morning that the market was headed for a gap fill after gapping down about half way to the bottom of the lower end of the current "Chop" range.
Since the intraday 3C charts have gone leading negative.
It's the actual price decline though that is useful in determining underlying action and what the next near term trend will likely be.
SPY 3 min is also leading negative, this speaks to where the market is now and the underlying trend which looks like distribution on the gap fill or attempted.
The 5 min chart scaled out shows a very clear trend, but the more immediate concern is day to day as it determines our tactical entries, strategically if we zoom the chart out to the cycle's scale, there's a clear negative trend strategically.
QQQ
Intraday the same positive off the a.m. lows and negative in to the gap fill highs of today.
The QQQ 3 min shows the relative strength of the QQQ 3C charts I mentioned earlier as it remains in line with price.
QQQ 5 min shows the positive divegrence and a "not so bad" negative which almost looks more like a sideways consolidation signal than a negative price decline,
that's not usual for a 5 min chart, but considering the preceding positive, that's my take for the Q's.
IWM

The trend is similar, timing different, but intraday lows from yesterday saw the intraday positiver and now a small leading negative in to today.
The 3 min is a bit more clear as to many of the recent moves being distributed.
The 5 min shows essentially the same as the 1 min, positive accumulation in to the lows yesterday or rather Friday and some negatives, but they are fairly weak.
DIA
Same theme, intraday lows today saw accumulation for a gap fill apparently and at that gap fill 3C goes negative and leading here.
2 min similar to some of the other distribution at highs, but this is also consistent with range bound trade, the difference is the positives aren't as consistent as the negatives
and thus the downward sloping price trend.
The 5 min DIA seems to be showing a more negative character, this may be suggesting that the chop is coming to an end, but I wouldn't make that call
the same way I was willing to make the chop call, there's just not enough evidence. A move lower could still be accumulated and that's why I want to see it.
TICK
This is the NYSE intraday TICK (number of all NYSE advancing issues per bar minus the declining issues), this is a good, quick look at market breadth intraday, it also often will call out a change in trend just before price as the TICK will lead price.
My Custom SPX/TICK Indicator (Histogram)
This is intraday, in yellow that's where the trends up and then down get sloppy as the previous downtrend gets noisy.
The TICK trend since the 10/9 cycle lows to present, they moved up with price early on as should be and then went negative in a pretty clear trend, that tells you about what has been going on with the actual stocks and not just the average.
I'll have more, I
think this is still an environment to be careful in with short term trades, it can be useful for tactical entries/exits, but you need strong signals in the asset beyond just the current or recent chop.


No comments:
Post a Comment