Tuesday I posted an XLK/TECS update and the gist was still that XLK wasn't there yet, the rounding process, the Igloo with a chimney pattern wasn't there yet, but I do still like it and continue to hold TECS long as a trading position.
Yesterday I added to the TECS position by a little. So I'm happy to see XLK underperforming today.
Today among other areas of dispersion in the market, Technology is seeing it too, which is unexpected when looking at the Q's (tech heavy).
. *Remember that tomorrow is an op-ex Friday, typically the market opens Friday near Thursday's close as it seems Thursday is often used to get the market near "Max pain", especially if it is way off as it would have been yesterday on the open with overnight futures down -10 points until the ECB/WSJ article.
Here are the updated XLK charts

This might have been because the NASDAQ 100 which is heavily weighted with AAPL benefitted from AAPL's close of +1.48%.
However, I wouldn't get too attached to AAPL longs...


AAPL 1 min intraday from in line to NO DICE, not even the 1 min intraday will follow AAPL higher.
*Market Makers, Specialists, Tech traders, etc. know what the flow or the tape is, these are the stocks they trade every day, they know who's buying or selling so it wouldn't surprise me if they were seeing trends in technology flows emerge and that's what we are seeing emerge in XLK.
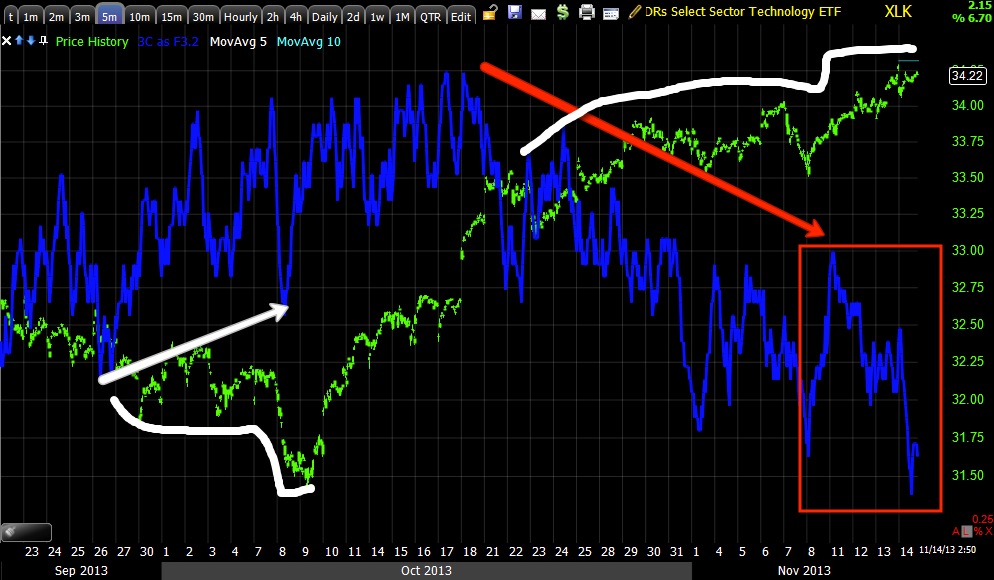
On the top side, we have about 3 trading weeks of distribution, I didn't count the mark up in the middle, we also have the Igloo/Chimney. THESE ARE THE SAME PROCESSES, JUST IN DIFFERENT SITUATIONS, BOTH HAVE HEAD FAKES, LEADING DIVERGENCES AND AREN'T TOO DISSIMILAR IN TIME.
If you haven't already, I'd encourage you to read the two articles linked on the member's site:
"Understanding the Head Fake Move: How Technical Analysis Went From an Asset to a Trap"
Understanding the Head Fake Move: Motivation


This is the 3 min chart, divergences migrate to longer timeframes"IF" they are strong enough.
Here we see accumulation right at the area I called a mini cycle a week ago tomorrow. The leading negative divegrence is CLEAR, but look at where the divergence started!!! It started RIGHT AFTER PRICE MADE WHAT WE'D CONSIDER A HEAD FAKE MOVE ABOVE RESISTANCE.
Selling in to strength, buying weakness, both are visible on the same chart.
It goes without saying, I like the TECS 3x short technology long trading position added to just yesterday.


No comments:
Post a Comment