HYG (High Yield Corp Credit) is one of smart money's favorite assets to express a "Risk On" position in the market. Smart money use to use real credit, however after the 2007 top, banks started writing credit off their balance sheets and just like when you go to short a stock and your broker doesn't have it available to lend, more and more large institutions that wanted to diversify a credit position were finding the banks didn't have enough to lend and certainly not enough to diversify a credit position.
(High Yield tells you they are long risk and positive on the market / Investment grade tells you they are looking for safety and bearish on the market)
As such, algos read HYG (created as a High Yield diversified Credit proxy that smart money uses like we might use an ETF) moving up as smart money being bullish the market and algos buy stocks.
The rest of the SPY arbitrage includes two other assets, this is straight from Capital Context's explanation of the construction of their SPY Arbitrage model...
"In much the same way that a company’s valuation varies due to business condition uncertainty and its cost of capital, so the broad market can be modeled based on its capital structure. Through years of ‘capital structure arbitrage’ experience in the credit derivative markets, Capital Context has created the ‘SPY Arb’ model which identifies a tradable relationship between the stock market (SPY) and its value implied from interest rates (TLT), credit risk (HYG), and volatility (VXX). "
As for VXX, it represents short term VIX Futures, it's not an actual VIX future contract, but a blend of the forward (closest months). Algos read VXX being down as traders confident and not looking for protection, conversely a rising VXX (we must distinguish between 3C and actual price as only we see 3C) tells algos that investors are fearful and reaching for the safety of a VIX hedge.
Finally TLT represents 20+ year bonds, traditionally and in the model, a rising TLT meant a flight to the safety of bonds and out of stocks (that relationship has been skewed by QE), but algos still seem to take that cue as we saw Friday. Conversely rising rates and falling Treasuries are interpreted to mean money is flowing out of bonds and in to stocks and the algos see that as a buy signal.
In reality the week previous to last we saw a huge move in domestic equity Mutual funds (which tells you almost immediately that this is dumb money) out of Bond funds and in to stock funds, essentially dumb money feels they are missing the party and leaving the safety of bond funds in what has been termed the F_E_D induced "Reach for yield", after all, if your bank account was paying 6% interest (I remember when mine paid 12%) you wouldn't be so eager to take risk, however the F_E_D has created an artificial situation forcing investors to reach for yield.
In the SPY arbitrage modeling (although HYG has been used alone a lot more often recently, HYG up, TLT and VXX down means "Risk on/buy stocks" for the algos, conversely HYG down and VXX and TLT up means risk off and sell stocks.
This is why I noted last week the 4 days of the market trying to hold HYG together while the last 3 of those days they spent time trying to suppress VXX. As you saw in Friday's daily wrap, the market didn't move until 11 a.m. when the 3rd asset, TLT moved down. In any case, short term manipulation can be accomplished as smart money has largely left credit in droves from late May through June.
Here's today's SPY Arbitrage Model, clearly activated but you could tell that just from HYG and VXX's price position.


On Friday, I had already had an idea HYG and VXX were to be used because the day before I had commented how one (HYG) was being propped up while the other (VXX) was being held back.
However when HYG gapped up Friday to help move the market (no it wasn't about some apathy toward the NFP) I was interested to see someone was using that price strength to either sell or short in to.

This is why I was so interested this morning in what would happen in HYG today.

However late intraday you could see them trying to prop up the SPY Arbitrage in HYG 1 min

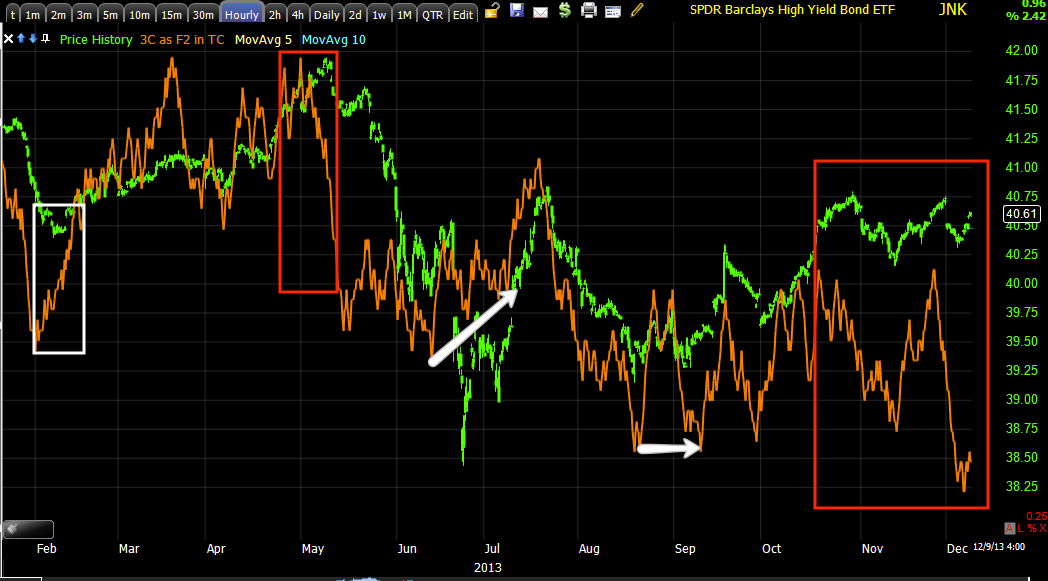
What is interesting is that Junk Credit is High Yield as the warning, "Junk" would imply, but it seems to have no relation with the market, but it tracks HYG nearly perfectly.

To make it even more clear how close they track and when Credit REALLY left the building...

HYG and JNK are similar in tracking Very liquid US high Yield Bonds, but one tracks Markit, one tracks Barclays, still they are nearly identical and not that different in size.
What I find interesting is looking at the JNK 3C charts as JNK doesn't seem to be used in any arbitrage scheme.


Now look at the same 3C 5 min chart for HYG...


The point is, regardless of the fact HYG is used to manipulate the market, both are seeing strong distribution on any price strength.
"Credit leads, stocks follow"


No comments:
Post a Comment