"Chaos"
I've been showing you the changes in character not only this year, the last several months, the last few weeks, but very recently. Last night I ended the Daily Wrap by saying I think we are going to see some "Unusual and unexpected" developments.
If I had to look at the market this morning and give an opinion, it would probably be somewhere along the lines of an intraday bounce, later in the day after looking at some leading indicators, it would probably have been along the lines of maybe even a tradable bounce, but only in certain areas as dispersion is becoming almost untraceable whereas the market use to move all together, all the same direction, all about the same size moves; I even said back then, buy/short the SPY, the Q's the IWM, it doesn't matter, they all move together.
THOSE DAYS ARE GONE and are rapidly being replaced by something much more chaotic.
Now I look at the averages about every 30 minutes at a maximum timespan and often much more often, earlier today I saw dispersion in the Q's compared to the IWM especially, but I wasn't excited about a trade there. Within an hour or so, things changed and I don't mean in the Q's alone, I mean EVERYWHERE, it is truly chaotic.
As far as the Q's and why I'd consider a SQQQ long (3x leveraged QQQ short) or maybe even a QQQ put if I can buy the put in to QQQ upside momentum and 3C negative divergences.
Here are the Q's (I'd love to see the breadth within the NDX-100, maybe I'll check that out)
QQQ 60 min. Entire October 9th low Cycle, what I've been trying to point out is the Oct Cycle that moved in to stage 3 around late October-mid-November and the break above that range which is a common theme in the average, industry groups and stocks, the distribution of that breakout makes the entire area look like 1- large head fake, what's important to remember is that the moves are proportional most of the time so the head fake wouldn't just be for the October cycle, it would be for a much larger trend reversal. This distribution of this area is such a common event that I've spent a lot of time trying to highlight it.
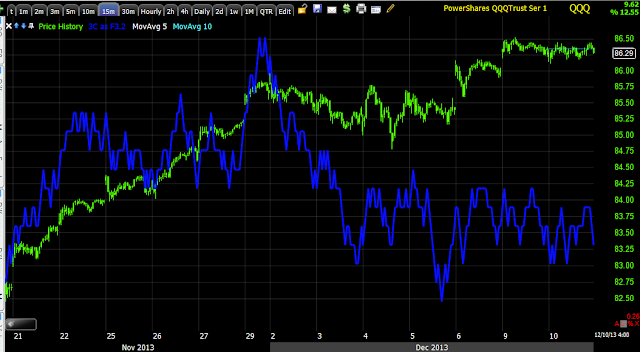
The 15 min chart confirms distribution at what would be stage 3 of the October cycle and then additional distribution on the move above it.
This 10 min chart also confirms the same, as we look at faster charts we get more detail, so the distribution can be seen at the very first break above the trendline that dropped back below and leading negative at the subsequent break over the trend line.
You know how I always warn about these really tight, flat ranges that seem to be "boring areas" and I often compare them to "The kids in the room next door being a little too quiet, you know they're up to no good", well this is also where we almost always see distribution (in this price/trend configuration) and accumulation , the 1 min 3C chart makes it very clear what's happening here.
This is an intraday view of the 1 min chart, earlier it wasn't very exciting as it was in line, then this afternoon it leads negative to a new low on the chart, a pretty fast change from "uneventful" to "interesting".
The 2 min chart confirms and shows the divergence migration to a longer timeframe, also look how much damage was done today alone, of course in that flat range (think filling at VWAP).
The migration continues through the 3 min chart, note how much stronger the leading divegrence is at the flat range.
If the Q's were to gap above the range or move above the range, I'd be interested in a put option, otherwise I'd be more interested in an equity short, or 3x leveraged ETF like SQQQ.
There was a lot of this changing today across all different assets and very fast.
Is interest rates about to start going up?
-
Yes, I know - it does not make any sense - FED is about to cut
rates...but....real world interest rates are not always what FED wants it
to be.
6 years ago


No comments:
Post a Comment