I'll try to show you the clearest trend/view of the market. I would say what I expected last night is still the highest probability, but stretched out more, this could be just to try to maintain the market in to tomorrow's close so the year end doesn't chip in to the year.
The other possibility is one I find to be more common, "Whatever you expect in terms of time and movement, double or triple it and you'll likely be much closer".
This is because we look at the market with our rational mind, the market is far from rational, it's a cornucopia (that's a good holiday word right?) of extreme emotions, and as such, extreme market behavior.
SPX Futures...
1 min chart, you can see what I mean about intraday, although price action looks to be either at a standstill or negative, either way it would be taken as negative because a standstill is a loss of momentum that invites a reversal, just like having a compromised immune system, it's just inviting a virus or bacteria.
The 3C charts are what show me something a bit different than price, but as mentioned last night (although timeframes are off), the overall concept here is movement, it's not anything significant, just movement. If you are in to watching mixed martial arts, a lot of the strikes are not meant to win the match in and of themselves, they are to create movement to create an opening, the market is much the same and if you've read my articles, "Understanding the Head Fake Move" you'll understand why.
ES 15 min is where we have a strong firewall, at 5 min we have in line so it's not even positive there, the former 5 min negative divergences have been pushed out to longer timeframes (migration) as discussed last night.
ES 1 hour, this is really horrible especially considering the VIX futures in the same timeframe confirming.
HYG has been destroyed as I showed last night, but intraday, this is a 1 min chat and note even the rounding,
it's important to keep the timeframe and the size of the rounding process in mind since they are proportional. A 1-day 1 min chart rounding positive does not lead to a 1 week bounce. A 1 week rounding positive divegrence does not lead to a 1-day bounce, vice versa more or less.
HYG on a 15 min chart with a very nasty leading negative divegrence, what is interesting is the range and the triangle in the range, this is taken as a bullish continuation triangle and today would be a head fake move that shakes out longs, but this asset is not one that many retail trade so I'm not so sure the concepts of head fakes and Crazy Ivans apply as much here. This is more of an institutional asset and even as a manipulation asset, most retail traders have no clue that it is used, I'm sure most haven't even heard of it.
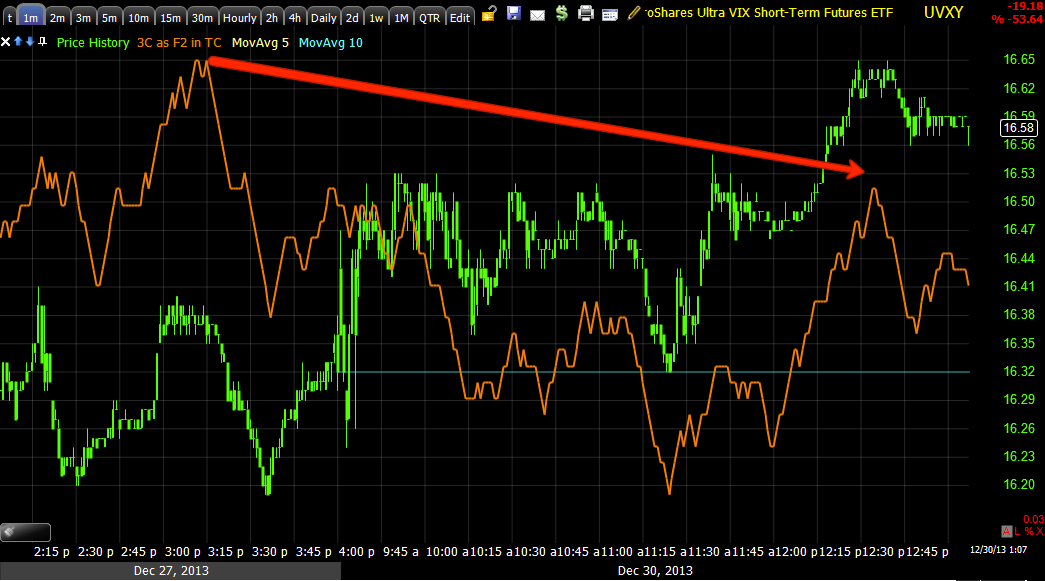
VXX / UVXY 1 min pinned like I've seen several times before, I think it was pinned right before the F_O_M_C and before Quad Witching and also pinned on a market decline toward the EOD that started getting ugly,
that doesn't mean it's not being accumulated, in fact any one accumulating would be quite thankful that price is pinned because it's a better entry for them.
3 min positive and price is up on that and then the pin.
But again like HYG (only opposite), 15 min is leading.
As for the real VIX futures.
1 min pinned just like short term vix futures above.
But at 5 min there seems to be pretty clear signs that it's being accumulated.
At 15 min it's very clear as is 4 hour.
I suppose if this stretches out longer, the question will lean more toward "Is this what I initially expected last night or is this just trying to pin the entire market in place for the last day of trading tomorrow?"


No comments:
Post a Comment