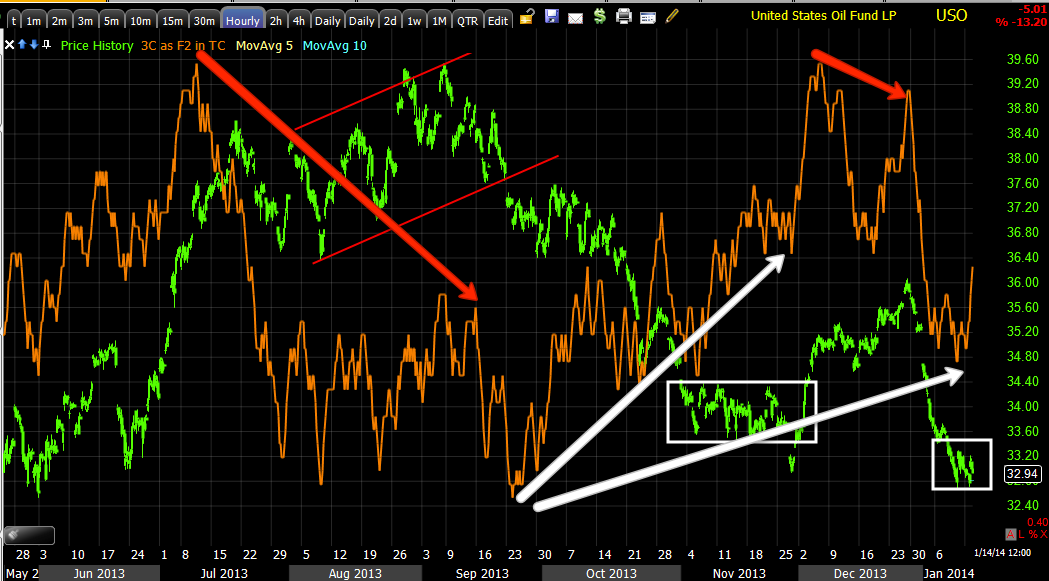
We have been very patient waiting for a USO trade (long) to set up, mostly based on this chart.
USO 60 min from left to right... Distribution in a parallelogram, price declines in to accumulation (white) and there's a quick head fake move below the range just before price lifts off, we didn't enter here, although I thought we would, I'm fine that we didn't, but even if we had, we saw the pullback coming so we could have exited the long. You can see a small relative divegrence (much weaker than any other divergence on the chart) at the small red arrow which led to the current pullback and what
is now looking like an even larger "W" or small double bottom base and true to form, it has even made the lower low that these patterns are now dominated by. We have accumulation at the current consolidation area, although it's a little small.
On the same chart without 3C, (1) stage 3 distribution, (2) stage 4 decline, (3) stage 1 base (4) what looks like a larger "W" base forming and small distribution for a pullback move and (5) what appears to be the second half of the "W" so in essence, number 3, 4 and 5 would all be a stage 1 base. This changes the target for USO from the $38.50 area to somewhere closer to the $40 area which always made more sense to me as it would move above the pattern at #1.
This is the pullback area, we have the typical rounding process with a head fake move that gives it that "Igloo with a chimney" appearance.
On the downside it's difficult to tell which area is the start of the process, whether it's a bit larger or smaller, either way,
the bottom reversal process is almost always tighter than the top reversal process.
USO 30 min chart since the last pullback and at the current consolidation area, that's a decent divergence on a strong timeframe.
The intraday 1-3 min charts have more detail, you can see the 1 min chart (also the weakest divergences) negative at the top where the last pullback started and then almost perfectly in line (confirmation) on the decline and transitions to two accumulation zones forming a "W" and when prices move too high at the mod point of the "W", we have a little steering divergence to send price back down in to the range.
There's migration of the divergence from the 1 min to 2 min with a leading negative divegrence at the top/pullback and again positives at the current consolidation including a leading positive (strongest) divergence.
The 3 min chart also has positive migration, a lot less detail as is the norm, but the trend is clear with a leading positive divegrence.
These are Brent Crude Futures, they are not quite the same as USO's WTI crude, but the overall tone is what I'm looking at...
This 60 min chart (remember futures timeframes are different than equities), shows the same negative divegrence at the top/pullback area and a positive in the consolidation area now.
As far as timing, intraday right now (1 min) we have a perfectly in line signal, I suspect that the gap below from today will be filled.
I'll be watching for USO's 3C charts to start to lead strongly if/as the gap is filled. There may be a head fake move just below the range (stop run) as there was on the left side of the base just before it took off. If there's a head fake move I'd consider February or maybe even March in the money calls. Otherwise I prefer USO long or maybe one of the 2x leveraged ETFs.
You might want to set some price alerts for a gap fill and/or a head fake move below the hammer on the daily chart.


No comments:
Post a Comment