In any case, yesterday we got some upward movement away from the rounding base, I kind of expected it from 3C signals in gold miners, but more importantly in Gold itself which GDX has a correlation with and seems to have followed it yesterday. The bottom line is I think everything is still fine and this is one of the best examples of forward forecasting for a trade set up that not only comes to us on our terms, but has confirmed every move it has made along the way from a false breakout/head fake move that was expected to produce a fast move below the trading range, to the accumulation of GDX/NUGT below the trading range in a beautiful reversal process as well as the larger picture suggesting this is not just a trade, but more than likely a very serious trend.
This is the kind of edge I crave in trades while everyone else only sees price action and probably rather uninteresting price action at that.
NUGT 1 min with a positive divegrence in to yesterday's minutes, essentially following GLD,
2 min suggests NUGT not wander too far from the reversal pattern it's putting in.
3 min shows EXACTLY what we want to see at a price formation like this, accumulation, that's what it was meant for, that's what we were forecasting as NUGT was still above the $38 area.
Usually there would be some sort of head fake move on a reversal pattern like this just before the actual reversal, if for nothing else, the bear trap it creates causes stronger upside momentum when the breakout comes.
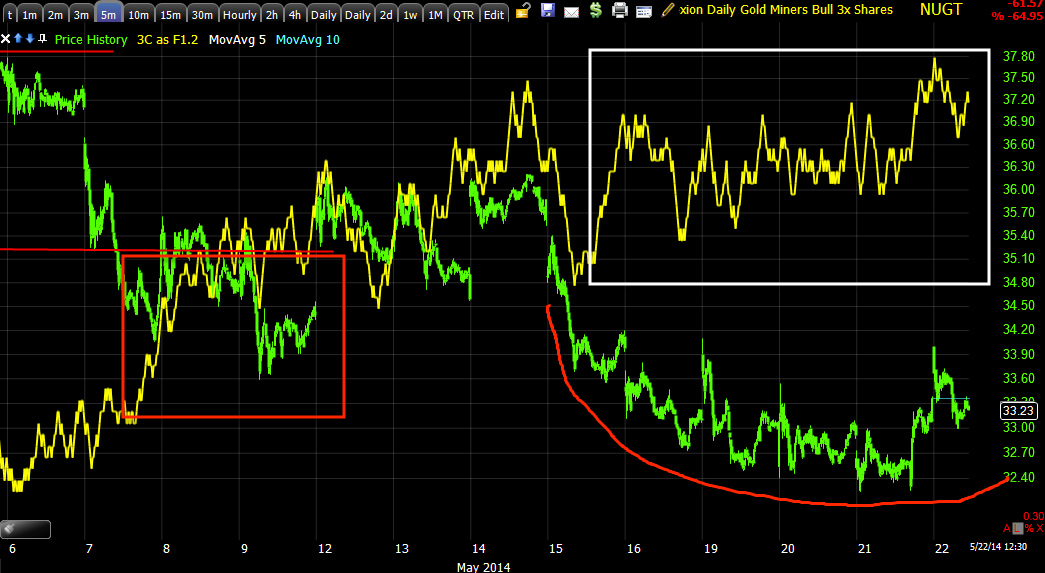
Again the 5 min chart waiting for the reversal pattern BELOW the range to begin before serious accumulation starts.

10 min...
This is the head fake / False Breakout or failed breakout that we were forecasting to not only fail, but to create the downside momentum needed to break under the range where we expected GDX/NUGT to be accumulated.
The white arrow shows the accumulation below the range, EXACTLY what we were looking for and giving us excellent confirmation that NUGT will be a strong long trade.
The actual head fake above and what will ultimately become a head fake below, is a larger scaled version of a Crazy Ivan with the range acting as the price formation that defines the support/resistance levels.
Note the repair of the 10 min chart. While we were still showing a negative divergence at the false upside breakout, we were looking for the 10 and 15 minute charts to be repaired. The 10 min chart has now been completely repaired, we still have a little work on the 15 min.
This the 15 min trend. There may be a much larger base pattern that I've talked about before and /or this Cup and Handle Bottom may be a part of it.
Note where the accumulation is, at the cup and the handle as it should be.
This is a closer view of the 15 min chart, it has a bit of work to do, but I'd say it's in line with the amount of time left in the base/reversal formation which I'd say is at least halfway completed. A head fake move in this rounding base pattern would be an ideal area to add or start a new long position as well as to look at call options. I'll set price alerts for a move below support of this rounding pattern.
The 30 and 60 min charts have always been in good shape so it really has just been a matter of finishing up the handle portion of a much larger base and it looks like we are about there.
60 min
 And the major underlying trend of the base area on a 4 hour chart. The accumulation at the cup is fantastic, but the increased accumulation at the handle area is EXACTLY what is suppose to happen in this pattern, Technical analysis just assumes it to happen, here we can see it actually happening.
I see this as a trend trade, likely a primary trend or perhaps an intermediate trend, but a large trend trade and stage 2 is the easy money, that's the move we are looking to trade by entering a position very soon.


No comments:
Post a Comment