Based on a 3 year study of information gathered from the CME analyzing 5 options markets, the S&P 500, eurodollars, Japanese yen, live cattle and Nasdaq 100, three out of four options expire worthless. Looking at put options alone, 82.6% expired worthless for these five markets *this is subject to the trend of the underlying asset. a 3-year CME study (1997-1999) found the same, of options held to expiration , between 75.8 and 77.5 expired worthless.
In any case, the actual open interest use to be used to try to calculate where max pain would be, now there are plenty of online calculators that use the dollar amount rather than the open interest, but very few are real time and only updated at the close which makes it difficult.
Note today we've stayed pretty much in a tight range...

In any case, I don't know if your broker bothers me as much as mine does, but come Friday I have emails and numerous phone calls asking what I intend to do with option positions that still may be open. I've noticed by about 2 p.m., most contracts seem to be closed and the market starts to move away from the op-ex pin.
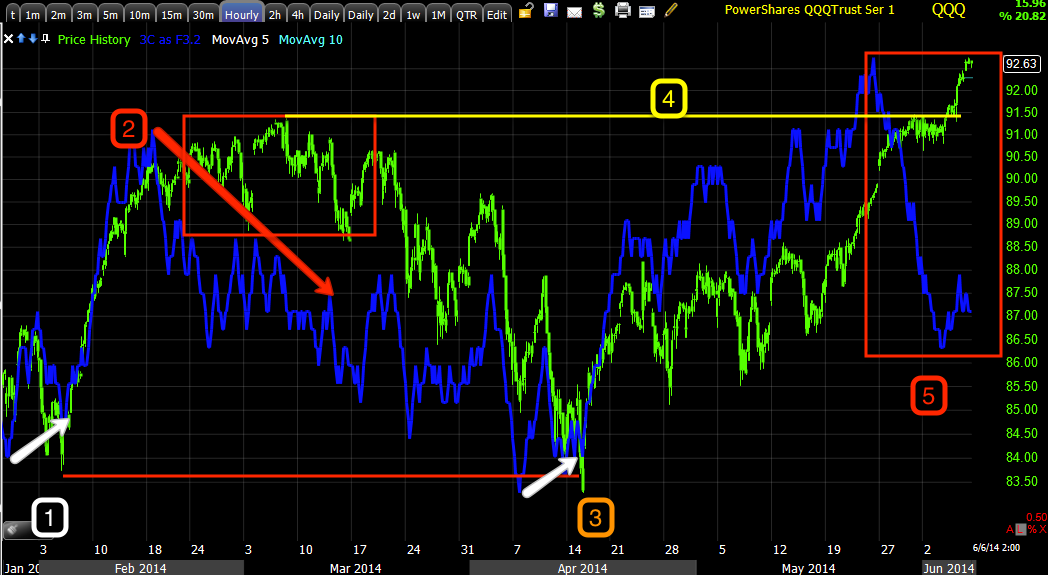
However, more importantly the last 2 hours of Friday tend to give me some of the best 3C information for the following week, this has included the February rally that we were able to predict as early as Jan 28th, especially the head fake move on Monday February 3rd and all of this at least 7-days before the actual move started which was described as going to be "Very scary". We've been able to forecast ranges , even head fake moves of major consequence all from the last 2 hours of 3C data which may be very different than price data as 3C tends to pick up right where it left off on the next trading day, even over a weekend , even over a holiday weekend.
I'll be looking for those underlying trends for next week and may open some positions. Looking at QQQ, PSQ, QID, QLD, TQQQ and SQQQ, they all are EXACTLY the same with the worst leading negative divegrence since at least early February. *I'm holding SQQQ long and will continue to do so.
Here are the charts of the 6 different leveraged versions of QQQ long/short, although they move almost exactly the same in terms of their leverage vs underlying asset movement, 3C is largely based on volume, the volume between the 6 different assets is totally different, therefore any divergences that match up, are because there's something going on there, not because of the correlation between the assets.


TQQQ is the 3x leveraged long QQQ ETF, it too is in a massive leading negative divegrence as soon as resistance is crossed, a breakout.
Finally...

SQQQ, the 3x leveraged inverse or bear QQQ ETF which is the position I hold long. There's distribution as there should be early Feb., a positive divegrence at #2 and at the break under support (head fake move we were expecting around mid-May) has a huge leading positive divegrence, larger than anything on the chart.
All 6 charts have nearly perfect confirmation and very strong divergences.


No comments:
Post a Comment