I have a more interesting post that specifically has to do with where the market is and why I might even take out longer expiration puts here, rather than next week's expiration, but it's a bit longer to explain and I wanted to get these charts out, a few interesting pieces of the puzzle come together.
In any case, relating to the last post of Futures and VIX future...
ES /S&P E mini intraday

NQ / NASDAQ intraday
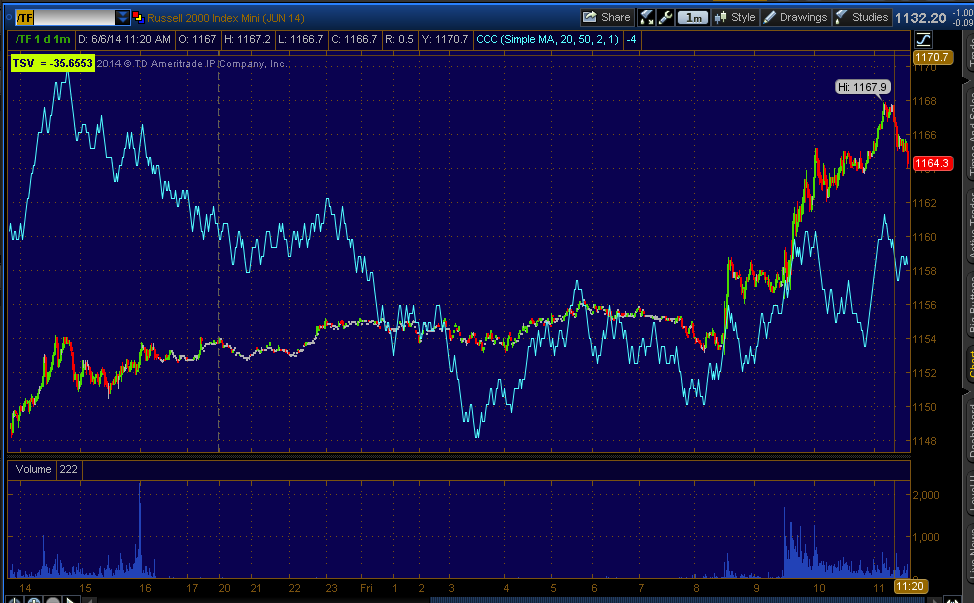
TF /Russell 2000 intraday.
I don't particularly believe in "V" reversals in any timeframe, however this does look like it's coming down, especially given the other evidence from the averages, the general concept of the multi-month head fake move, Leading Indicators , Treasuries rallying, but for now I'm looking more intraday for tactical entries.
And VIX Futures, not spot VIX or the 2 month rollling VXX short term futures, but VIX futures, the Rate of Change in price has fallen off from down to lateral and at that area it is leading positive.
At the same time, this morning's NYSE TICK Channel just failed.
I'll try to get the gist of the bigger picture out in the next post unless the market starts moving fast.


No comments:
Post a Comment