DUST (3x short Gold miners) was entered as a pullback trade for GDX/NUGT, although I like GDX and NUGT a lot on a primary trend basis, their inability to breakout convincingly of the year or so long base caused us to close our NUGT long at a +40 and +50% gain on the same day it broke out, which had poor signals. It was a good thing we closed the positions on that day as we left nothing on the table as an expected pullback in GDX and NUGT which was the reason for the DUST long, took months to materialize.
As far as why I'm closing DUST at this point, this was a pullback trade, not a trade that was in line with the primary underlying trends. I see some interesting activity in GLD and GDX, which have a close correlation, this morning and GDX has pulled back to the expected area of a pullback, even though it took quite a bit longer than anticipated to do it.
I'm not looking at adding to NUGT right now, although it's a position (or GDX long) that I do like a lot for a longer term primary uptrend, but I think we may be in the area where it will build its base making DUST sideways money , risk and opportunity cost.
The DUST long should come in around a +38% gain, which hedges some of the shorter term NUGT swing long (expected shorter term swing move to the upside).
I'll be looking to add to NUGT, possibly a GLD position , but I think we are early in the process for that, however there is a change in character that tells me DUST is likely spent other than lateral chop.
DUST intraday negative divegrence
The same divegrence migrating to longer charts already...
This is the longer term daily GDX inverse H&S base, the white arrow is around where we bought NUGT long and the red arrow on the breakout above the neckline is where we closed NUGT long and shortly after expected a downside pullback which obviously took a while longer to materialize than expected, but did pullback and to the approx. area expected.
A closer look at GDX daily with the NUGT entry for a +40 and +50% gain, sold at the breakout day at the red arrow. The yellow arrow is where we were getting pullback signals for GDX. We didn't leave anything on the table with the NUGTY sale as the trend went lateral to sideways chop before actually pulling back.
The longer term DUST 10 min chart shows the approximate area where we were getting confirmed signals of a GDX pullback (DUST Bounce) and you can see that divegrence has deteriorated.
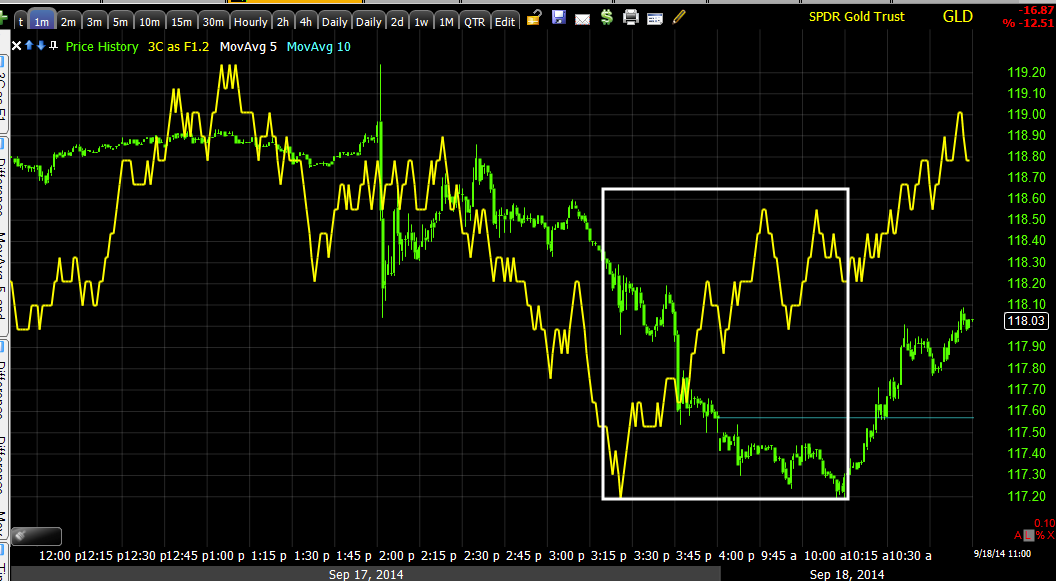
GLD is showing some interesting activity this morning on a Star (bullish reversal candle) as well as GDX. Look for the daily volume to rise on one of these reversal candles, although I don't expect a "V" shaped recovery, this will likely take a little more time, but probabilities seem to be building in that direction.
GDX showing the same bullish behavior this morning...
As well as NUGT.
This isn't based on any one divergence, but on broad pullback expectations, the gap fill in GDX/NUGT, the daily candles and recent trend and some interesting bullish behavior that marks a change in character.


No comments:
Post a Comment