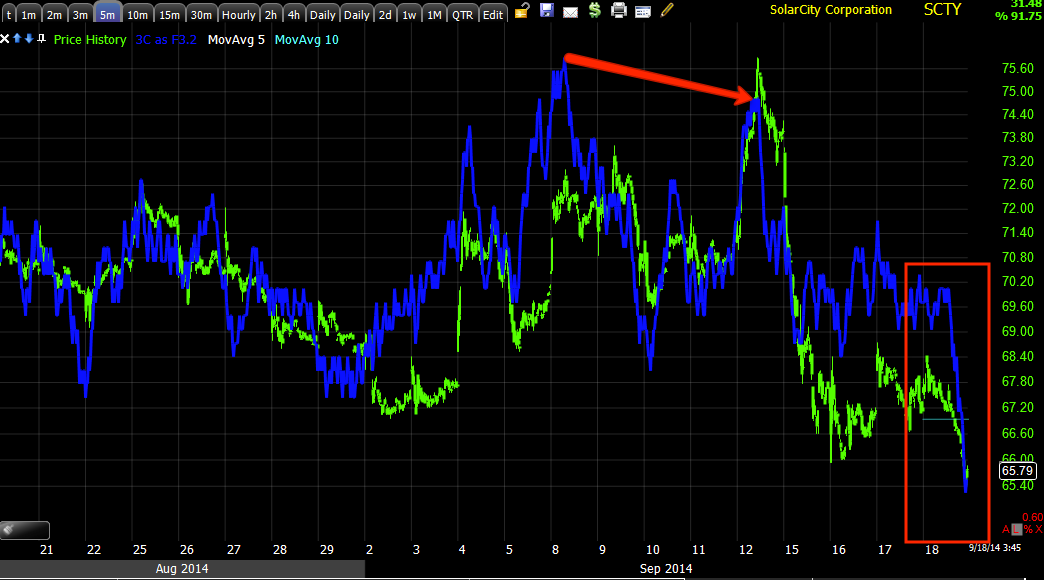
Even though SCTY has not broken down from the primary trend H&S top, we still have a decent 8+% gain on the position, leaving plenty of risk management room to add if we are lucky enough to get that break, but SCTY ha just been about relative weakness.
Here's the daily H&S top and the first two of 3 area I prefer to short a H&S top, the head and right shoulder, the last being the initial shakeout move after the neckline is broken, that's also the last place I'll short this pattern, but almost never at the break below the neckline as those shorts always get shaken out with stops just above the neckline.
This is why SCTY is among the list of other trades on the watchlist, a 2/4 hour chart leading negative through the entire H&S top and increasing at the right side of the pattern to a new leading low.
As for the right shoulder, because there is somewhat of a range, I had price alerts set above the range for an add to or new position, but the relative weakness has prevented any such move.
Te 15 min chart (and many others) confirm the same signal through the right shoulder making an entry really anywhere in this area a nice long term position, although I hate chasing, I think 6 months from now it really doesn't matter if we entered 4% higher.
Short term like the 5 min there's no hint of anything that may send SCTY above the range any time soon, just the opposite in fact.
And even at the 2 min chart, the strongest signal is distribution in to a move toward the top of the right shoulder range.
At this point if you are interested, I'd probably cancel upside price targets and look for any strength on an intraday basis or a short term basis which may be possible via HYG and the broad market, but SCTY itself doesn't have any of its own gas in the tank. An excellent looking core short position for a trend trade.


No comments:
Post a Comment