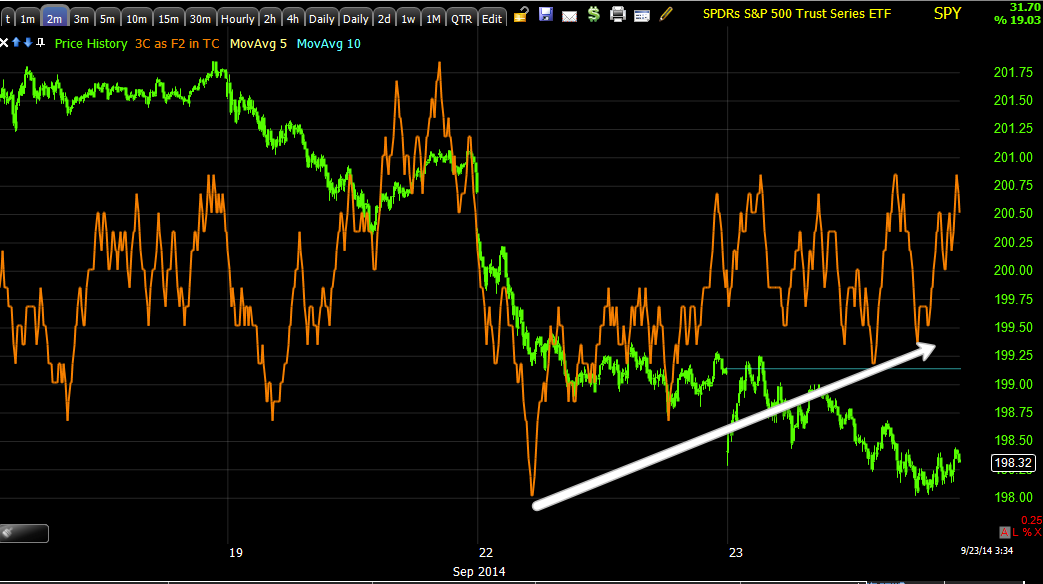
And here are the divergences I mentioned, except Leading (which were in professional sentiment and yields), I also verified using inverse ETFs.
QQQ 1 min intraday improvement
QQQ 2 min leading positive divegrence, quite strong and fast for the time frame.
IWM positive in the area of the head fake, that's what we are looking for...
IWM 2 min chart improving and starting to lead.
IWM 3 min chart still in a positive divgerence.
SPY 2 min improvement
SPY 3 min improvement
And 5 min improvement, this is what we look for to verify a head fake / stop run.
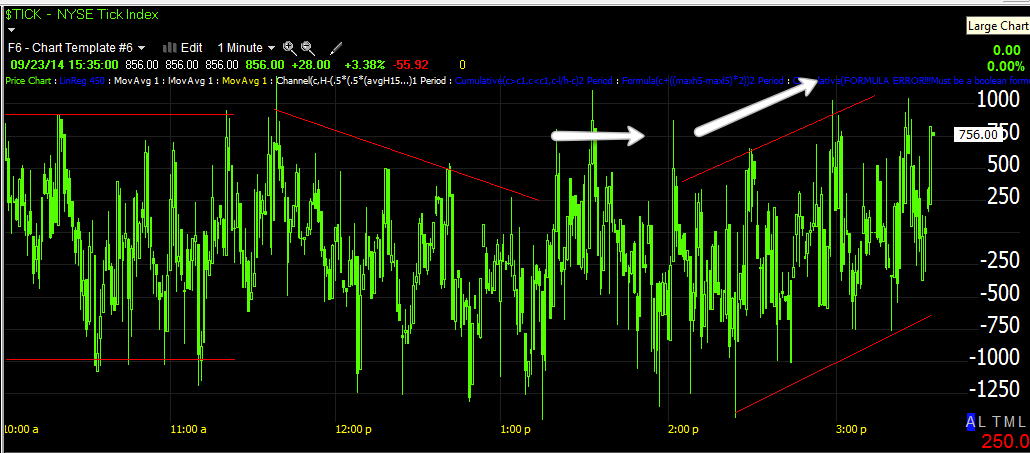
The NYSE TICK chart that was in a lateral range at the last update is trending up.
The Custom SPY/TICK Indicator shows a noticeable improvement in intraday breadth.
The MSI is inline with price, no squeeze anywhere I can see.
This should give us the opportunity to add larger, longer term positions rather than these short term intraday or day to day trades like the current IWM call, however, I like to try to take whatever the market will give within reason.
So far it looks like this week's forecast is still on track...
Is interest rates about to start going up?
-
Yes, I know - it does not make any sense - FED is about to cut
rates...but....real world interest rates are not always what FED wants it
to be.
6 years ago


No comments:
Post a Comment