I've already posted FAZ long (XLF short) numerous times, it's one I definitely want exposure to, Financials. Tech is another short, I prefer the Q's and specifically SQQQ (3x short the QQQ) and the one that has treated me the best which I never let go of is SRTY, 3x short IWM which is also like being short small caps.
So on any short term , oversold (breadth) bounce, it's these 3 first and foremost that I prefer as I have exposure to Financials, Tech and small/mid caps, it's kind of the base I like to build out from.
As for SRTY and SQQQ, here's what their charts look like and why I would snatch up some shares (if a 3x leveraged inverse ETF is your kind of trade) on any pullback (of course we'll be watching for signs of such a pullback ending to get the best positioning.
When you look at the longer charts like the 60 min charts, you'll see a near inverse, mirror opposite image of the market, it's at those spots where we have been calling the market's rounding top stage 3 and last week's bounce higher a head fake "Chimney", that you want to really pay attention to on these charts.
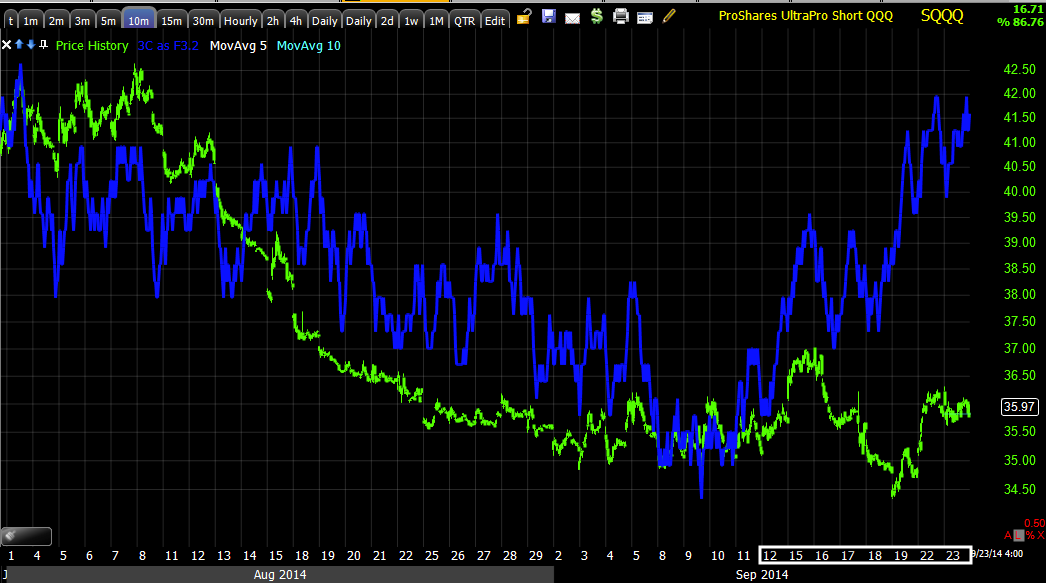
SQQQ
The 60 min chart is a mirror image (inverted) of the broad market's August cycle. I'd say judging by the 3C chart above, we can pretty safely say August 18th-25th or thereabouts was the start of stage 3 for the market's August cycle, breadth tends to show the same thing. To the far right is the head fake "Chimney" for the market last week, look at the leading positive divegrence in SQQQ at that area.
The 30 min charting leading positive position.
While the price has to follow the daily change in the QQQ, inversely with 3x leverage, the demand for the shares/accumulation does not and often diverges.
Because there are so few retail traders looking at the market as a short, I suspect the longs in SQQQ , SRTY and FAZ are what you call, strong hands, they aren't easily driven out by head fake moves and such and it's apparent on the 3C charts.
In other words, professional traders.
SQQQ 10 min leading positive divegrence at the chimney from last week, while market prices were higher and SQQQ lower, those lower prices were accumulated in size and speed.
Only the very short term 2 min chart shows any real damage of any kind, thus I love these on any kind of pullback you can get, I actually love them right here as Im not willing to part with them.
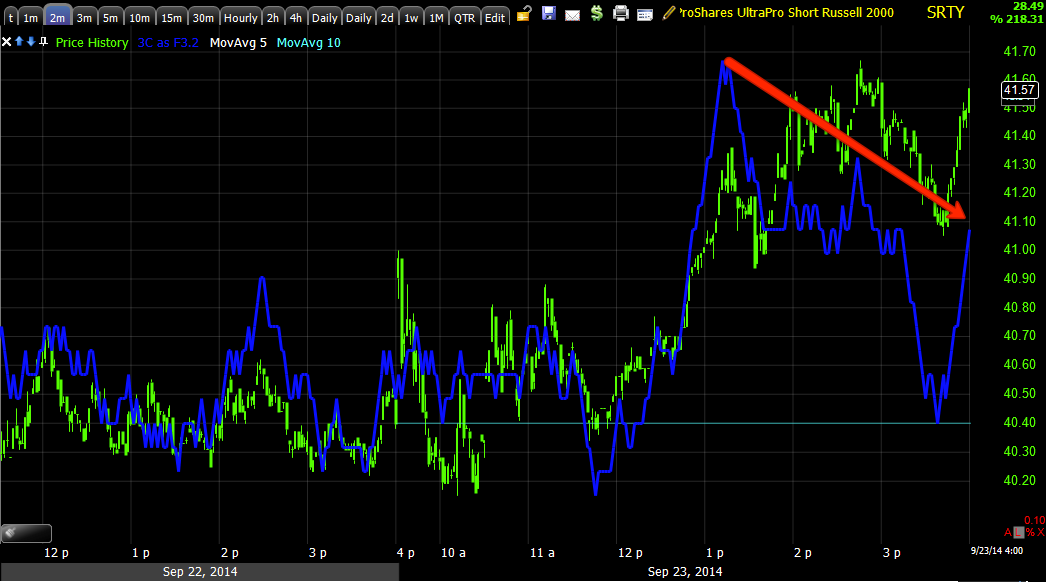
SRTY...
SRTY, IWM 3x short has a different pattern as the IWM is closer to a H&S top, note the accumulation zones, but more interestingly, at the downside reversals, no distribution signals make it out this far, again, evidence of strong hands willing to hold for the long haul.
Only on a 15 min chart do we see any negative divergence in those areas and they are the weaker relative negative divergences, again, strong hands in these ETFs.
SRTY 45 min in line with the IWM's downtrend and confirming SRTY's upside with a recent 5 min negative, although not that big or strong, it does give us hope for a pullback to pick up shares at a lower cost basis and lower risk.
Again, the negative divergences here are very small, this is a 2 min chart and other than the 5 min above, that'
s about as far as they go.
Again, vs the watchlist stocks, you see a different quality of divergence here, the kind I would characterize as strong hands.
Don't forget about FAZ on a pullback as well.


No comments:
Post a Comment