


That's right, AAPL, the heaviest weighted stock on the NASDAQ 100, we don't know exactly what unless we want to pay $10,000 a year for a NASDAQ subscription, but in the not so distant past, AAPL has accounted for over 20% of the NASDAQ 100's weight itself.
To put that in to context, that's about the same as the bottom 50 weighted NDX stocks so if you had the bottom 50 NDX stocks and AAPL and the bottom 50 averaged a -1% loss on the day and AAPL was up +2% on the day, the NASDAQ 51 (in this case) would close up +1% despite the fact that 50 of 51 stocks closed red.


As for the Averages today...

Somehow the SPX and ES managed to close right at VWAP...

However, don't forget the sell signal in SPX in our DeMark inspired custom indicator...

This might be dismissed if EVERY major average didn't have the exact same buy signal at the lows and sell signal now including transports and as of this week, the VIX which trades opposite the market so it has a sell and buy signal, the only two of the year.

If you noticed above, the SPX has a Doji Star today, now 5 of the last 6 days. The RUR which closed down -.90% has a bearish Engulfing candle today, The Dow which was up a paltry +0.23% also has a star and transports closed lower, -0.20% despite the fact oil crashed.
WTI was down to $74.06 at its lows, the lowest since Sept 2010 and the fastest downward ROC since the Lehman collapse. Brent Crude was down as well, -3.47% while USO was down -2.92%.
Take a look at Transports vs Crude, what do you think? Have they been popping on lower oil or following the market cycle?
In fact, seasonal gas is the lowest since 2010.
Note USO's break of the $29 area today and the large volume, I know some of you are interested and it may see a dead cat bounce, but for a sustainable rally it will need some work.
Treasury Yields are also getting interesting, I'm not so sure they led today as much as hit local lows for bonds to be accumulated... I suspect we are about to see a strong move in Treasuries/TLT which you might consider playing TBT (2x short TLT) SHORT, thus creating a 2x long TLT.


As we saw today, TICK was not even close to confirming the morning rally, it was trending the opposite direction. I was VERY surprised we didn't have a Dominant Price Volume Relationship, I even reloaded me data feed twice to make sure. However that doesn't mean we didn't get information, the intraday breadth sold off as the market tried to rally before the SPX tested red for the week only to be saved at the close with a dash to VWAP, but during that dash and otherwise through the day...


There was some $USD weakness on the macro trend of EUR strength we've identified (bigger picture) which didn't do much to precious metals with GLD closing at +.15, SLV closing -.40% , but DOCTOR COPPER (they call it that because it is suppose to be a leading indicator for market direction) GOT SLAMMED....
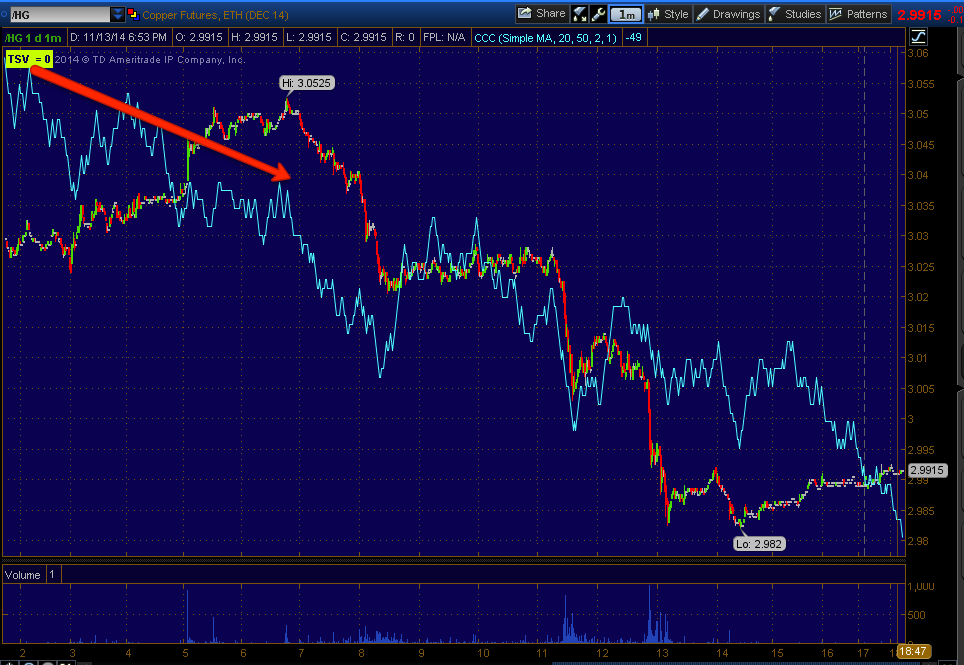
Many traders still follow copper as a global leading indicator and stock market indicator.

Yesterday I pointed out the near panic in the charts to accumulate protection, if Treasuries are the flight to safety, VIX is the flight to Protection.

Well we didn't have a dominant P/V relationship, but internals were still there to be seen.
4 of 9 S&P sectors closed green, but very weak, that's a range from +.02% to the best performer at +0.63%, Consumer Discretionary. Energy was the laggard at -1.33%,
Of the Morningstar groups, a weaker showing than yesterday with only 88 of 238 closing green.
While most breadth indicators haven't moved at all in about 10-days, certain ones did move, take for instance the Russell 2000 Advance / Decline line which deteriorated today as you might expect as did the NYSE A/D line and R3K A/D.
Momentum stocks represented by the "Percentage of NYSE Stocks Trading 2 Standard Deviations Above Their 40-Dayn Moving Average" which in normal times hovers around 35% has seen a rally peak of 25%, but has fallen off to 16%, 9% points in just the last 3 days.
The New Hi / Lo Ratios from 1-day to 4, 13 and 26 week are falling like flies.
And some of the Breadth Indicators are coming apart fast...


As for the late day divegrence, I reiterate, this was an intraday 1 min divergence in most cases which may have been just to ramp the SPX out of the red and back to VWAP or it could be for tomorrow's op-ex max pain pin as the market typically pins around Thursday's close or as I warned, in increasing volatility, small divergences like that tend to get run over more frequently.
I may not have the exact time and date of a decline, but I can tell you I'm as sure we are going to get a massive decline as sure as I am I'm going grey.
If anything interesting pops up in Futures, I'll be sure to let you know.


No comments:
Post a Comment