(Wall St.) can keep all of the premium; tend to be lifted around 2 p.m. to 3 p.m. as most brokers badger their clients in to wrapping up positions well before the close.
I t has also been my experience that what the market does the last 2 hours is a wild card, but has next to no bearing on the Week Ahead (Monday), however, the data we collect the last 2 hours is some of the best of the week and often leads to the following week's forecast, thus the data and price can move together or opposite, but it's the data that really matters for the next trading day (Monday).
If it wasn't clear this morning that we were in an options expiration pin, it should be clear by now as the market has been approximately +/- .15% for most of the day (as I said yesterday, the max pain pin is usually right at Thursday's close.
Here are a few charts going in to the release of the pin...
First the USD/JPY which has been analyzed 3 times this week with the major finding seeing $USD weakness ahead, Yen strength and Euro strength.
As per that analysis and more specifically last night's 3C charts at the end of the Daily Wrap already showing $USD distribution, Yen accumulation and Euro accumulation,
The USD/JPY which lead the market like a puppy dog yesterday...
USD/JPY (candlesticks) vs ES/SPX futures (purple) as of yesterday
The negative $USD divegrence and positive Yen divergence have kicked in...

The USD/JPY (candlesticks) today vs ES (purple) as the USD/JPY has lost ground all night and is making significant moves lower right now, however the SPX and futures are in a thin band of options expiration pin.
Even TICK data is in a thin band with virtually nothing going on other than the pin.
TICK in a very narrow range with no extremes.
Even the EUR/USD is higher as per analysis for a stronger Euro/weaker dollar.
The larger scale major dislocation of 30 year yields (red) vs the SPX (green), not to mention the horrid volume trend.
Short term which is what I was talking about so much yesterday as needing to be watched, TLT and 30 year Treasury future analysis has led right to what I was looking for in TLT and /ZB_F charts, the leading move lower, however the market is pinned for op-ex max pain.
The lever used today to accomplish this as the market is not only fighting Yields but the USD/JPY's losses, has been HYG, but remember this morning my warning that it only had a small 1 min divergence at this morning's lows. As you can see in red, HYG is now falling off as support for the market pin.
This is a close up of HYG's positive divegrence this morning and where it's at now as that divegrence fades to a negative within a larger leading negative.
This is a wider view of that leading negative.
This is SPY intraday trying to maintain that near perfect pin.
However while it may not be moving much, the trend here on the SPY 5 has made a new leading lower move.
The IWM intraday looks similar trying to maintain the pin or actually doing so...
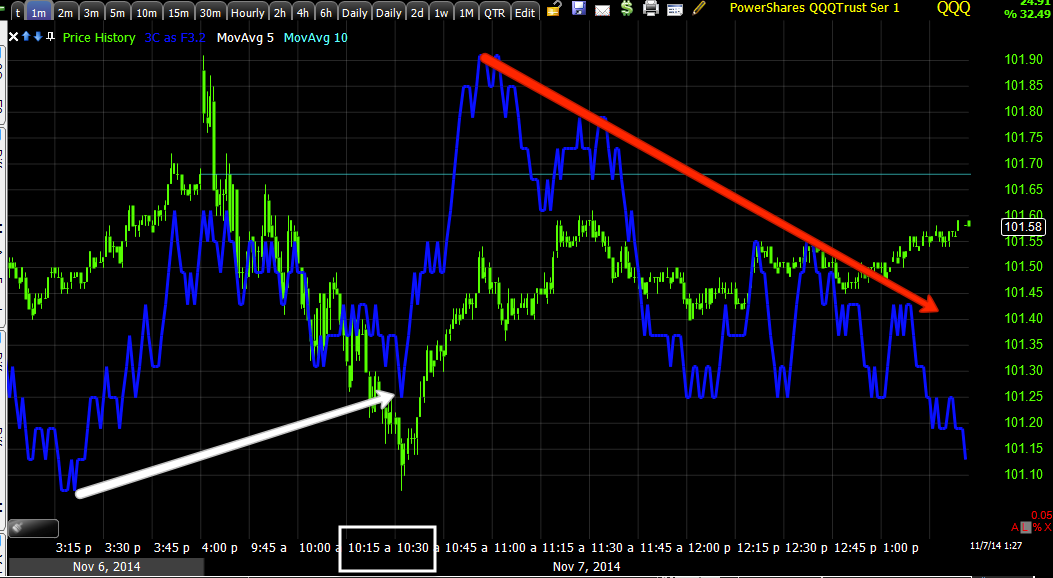
And the QQQ with a steering positive divegrence this morning, however that's starting to fade intraday as well.
QQQ 30min
Add that to the horrible leading indicators, yields breaking down, which may be a trade worth investigating, and I'd say we are in for some increased volatility (notice how it has dies to a trickle this week?).
More to follow... The last 2 hours I'll be collecting a lot of data for the Week Ahead post.


No comments:
Post a Comment