I have very high risk tolerance and prefer to trade strong swings often to roll over (accrue) funds, but there's a reason just about every one of my positions is aligned and staying aligned with this chart.

This is the path of highest probabilities as we knew it would be when we forecasted the October rally off the lows more than a week in advance. This is also the reason I have not put out new short trades as I would like to or bounce trades as we may be dead right on the scenario envisioned around the Russell 2000, but without a strong edge, the trade is not worth the risk, patience and letting the trade come to us on our terms is.
Volatility was evident in the market where the Dow had a 360 point range and an 800 point round trip and the SPX had a 44 point range and 100 point round trip.

The NDX as seen in 3C charts recently, was the worst relative performer and ironically, the IWM, according not only to our "scenario", but 3C charts was the out-performer as their charts have indicated in underlying trade.
There was also volatility in the Commodity space...

Volatility was also seen in Treasury yields as they lost 10 bps, then gained 10 bps and then lost 8 bps today.
Notably, the risk off moves we have seen in High Yield Credit started hitting the safe haven of Investment Grade Credit as well.
Volatility has been insane as is easily with a chart of the VIX.


However the US may have gotten off lucky so far. Across the globe markets are cratering, the MSCI Emerging Markets Index fell 1.2 percent. Developing-nation stocks slid to a 16-month low.
The
emerging-markets stock index has shed -7.8 percent in an 8-day
losing streak as of Dec. 5. Also in developing nations, a gauge tracking 20 developing-nation currencies fell 0.4 percent to the lowest since at least 2008.
The Middle East is being hit hard...Dubai’s
DFM
General Index (DFMGI) and Abu Dubai are down -8% since Friday with Dubai's General Market Index down near -40% since the peak in oil this June. Saudi Arabia’s Tadawul All
Share Index dropped -7.3% today for its biggest 1-day loss in 6-years. Most Middle Eastern markets are down 30-60% since June as oil prices started crashing, Kuwait is down almost -20% YTD. The exception is Qatar which is still green YTD. Yet even today Kuwait let the market know that OPEC would NOT be altering supply levels until the next meeting in June, sending the market packing lower intraday it seemed and all of this to defend
market share as the U.S. shale market was booming, now that’s exacerbating a global
glut along with a steep drop in Global manufacturing and demand with Japan in its 4th recession, Europe very close, Chinese data getting worse and worse and now...who knows what's next in Russia.
The
Russian Ruble is the worst performing currency in the world losing
about 60% of its value this year with the -48% decline in crude prices since June having an ever worsening effect on the Ruble as oil prices dipped below $55 a barrel. However the Russian Ruble is far from the only one stricken and the Russian Micex benchmark stock index is down nearly -30% this month alone.
Emerging
currencies slumped to a record with the ruble plunging for a seventh consecutive day.
An overnight report of Chinese factory output declining and moving in to contraction didn't help matters,
pointing to weaker demand for raw materials including oil. The US's PMI Manufacturing came in today at 53.7 on consensus of 55.2, the biggest miss on record and the 4th consecutive monthly US Manufacturing decline, also the 4th consecutive miss to expectations. Employment and New Orders slumped in the report's sub indexes and this after German PMI Manufacturing hit an 18 month low. In Markit's opinion, the slump in US manufacturing will hit hiring as the employment sub-index is already showing.

Things worsened throughout the day for Russia as first 3 retail FX dealers said no more trading in the Rubble as banks aren't pricing it, by the end of the day, short term finding by Goldman Sachs was cut off in short term repos with other banks likely to follow.
This was exacerbated tonight when the WSJ reported that, "Global banks are curtailing the flow of cash to Russian entities, a response to the Ruble's sharpest sell-off since 1998's Financial Crisis", which means Russia probably has about a week or two before they need to find short term funding as globally banks start to refuse to lend or repo with Russia amid uncertainties over the ruble and possible controls.
Among Leading Indicators at the close as things moved around so much today:

The VXX was in line with the SPX's correlation while the spot VIX severely under-performed.
TLT was about in line with significantly better relative performance at the European close.
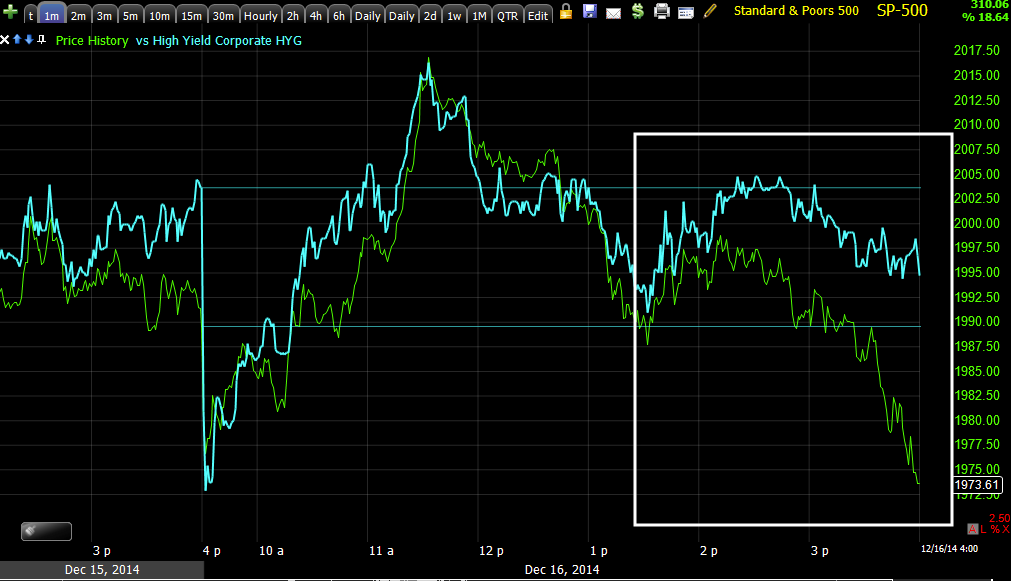


High Yield Credit which has also been leading the market via selling off vs the SPX for weeks, also closed with a leading positive component and this IS NOT the same lever manipulation HYG sees.


SOMETHING IS STILL GOING ON AS WE EXPECTED.
Interestingly our Professional Sentiment indicators that were acting apathetic earlier today, showed for the first time in a long time some near term strength, again along the lines of market and specifically IWM expectations.

5 year yields, although hardly a strong leading indication right now, are outperforming 10 and 30 year yields as the Interest Rate Yield Curve continues to bearishly flatten.
Today's Dominant Price/Volume theme was almost non-existient with no theme in the SPX or R2K, although the SPX did share two different themes that were near equal and dominant above the other 2 possibilities, both were Price Down with the difference being one had volume up and the other volume down. The R2K's theme was evenly spread out among the 4 possibilities with only the NASDAQ 100 and the Dow with Dominant P/V themes, both Close Down/Volume Up (14 of the Dow stocks and 50 of the NASDAQ 100). For the NDX and Dow, this theme is most often a short term (1-day) oversold event with the next day closing green, however we saw something similar with a short term oversold condition in industry groups yesterday that should have led to a green close today.
While we are on the subject, of the 9 S&P sectors, only TWO of NINE closed GREEN on the day as opposed to yesterday's 9 of 9 red. The leader among the S&P groups today was Energy at +1.16% and the laggard was Consumer Discretionary at -1.54%.
Of the 238 Morning star Industry/Sub-industry groups, 62 of 238 were green on the day.
Interestingly I looked at both the S&P sector and the Morningstar groups on a multi-day basis. On a 5-day basis, NINE OF NINE S&P groups are RED with Utilities leading at -2.13 and Materials lagging at -5.95%. For the same period of the 238 MS groups, ONLY 5 OF 238 WERE GREEN OVER 5-DAYS!
Over a 10-day period (2 trading weeks) AHGAIN OF THE 9 S&P GROUPS, NINE OF NINE groups are RED with Utilities outperforming at a loss of -1.98% and Energy lagging at -8.35%.
Over the same 10-days, only 14 of 238 Morningstar groups were GREEN!
On a 21-day basis, only 2 of 9 S&P sectors were green , again with the defensive utilities leading at +1.20 and Energy lagging at -13.92%.
Over the same 21-day period, only 67 of 238 MS groups were green. Interestingly besides the very ugly theme across timeframes, the defensive Utilities were leading so that's your recent trend.
Quickly , breadth continues to decay. Of the NYSE Stocks, only 26.86% are above their 40-day moving average (DOWN FROM 70% on November 26th, the last defense day of the market before Black Friday), while only 38% are above their 200-day moving average.
WHILE IT IS EXCEPTIONALLY CLEAR THAT THE PREVAILING TREND IS VERY NEGATIVE IN UNDERLYING TRADE, BREADTH AND LEADING INDICATORS, THE EXAMPLE THESIS OF WHAT I EXPECT IN THE RUSSELL 2000 LOOKS LIKE IT'S VERY MUCH STILL ON TRACK.
The market is still as broken as ever or rather much more so, but this head fake move is just a representation of that , although like many events where price is concerned, it may not seem that way at first, but book mark this post, such a Crazy Ivan RUT head fake move will lead to an even sharped downside move than last week's horrid performance , allowing us to add to short positions at better prices and much less risk with the best timing signal we have conceptually...THE HEAD FAKE MOVE, RIPE IN THE RUSSELL 2000/IWM.
The SPY, QQQ and IWM's closing 3C divergence portrays additional weakness tomorrow morning, but the divergences needed for our head fake move are still in place. I would suspect we'll probably see it sooner than later, in fact tomorrow's F_O_M_C looks like the most logical place as the Knee Jerk reaction would be a perfect place, perfect ignition and perfect cover for such a move. Remember that F_E_D events almost ALWAYS see a knee jerk reaction and it is almost ALWAYS wrong, so this would fit perfectly at the 2 p.m. policy announcement and the press conference following.
As for futures, gold looks like it will see some overnight gains, perhaps in to tomorrow.
All 1 min Index Futures are leading positive in to the overnight session and as expected, at least one of the Index futures has already seen the 5 min chart go positive, guess which? The IWM!
The 7 min charts remain positive so I think we are now on track with the remaining Index Futures to see their 5 min charts go positive in the overnight session as the 1 min. are positive and as I said, the Russell 2000's already went positive t0day as it was not earlier.
Tomorrow looks to be the day, it will be a busy one for us!
I'll update futures if I see anything standing out.


No comments:
Post a Comment