One of the things we have been looking for since first looking at AAPL this week pre-eranings in Monday's
AAPL Update and yesterday's
AAPL Update-Earnings was a move above AAPL's range, that wasn't hard to do on their historic profit.
The rest of the potential set up depended on what we saw after this high probability move was made, so we'll look at what we have so far. In my very early opinion I believe two things, 1) it seems AAPL is seeing distribution in to the price strength and demand and 2) a head fake move is usually not a simple 1-day affair, normally I'd say "Be patient", let it develop, let a reversal process develop, the only caveat to that today is obviously the wild card of the F_)_M_C in just about 3 hours.
This is exactly what we've been forecasting with a clear range in AAPL and it being one of the most popular assets out there, a head fake move seemed to be almost a certainty despite what AAPL's earnings were.
As for the response to earnings, I can't say anything specific about AAPL, I actually didn't hear their guidance, but the market is largely about perceptions and it's not so much what you did as it is what you did vs what the perception of what you'll do next quarter is relative to this quarter. In other words, "Was this as good as it gets because of the strong $USD potentially effecting overseas sales?" If so, then smart money may be inclined to sell in to price gains and demand while they can.
I may have an opinion on the matter, but that's irrelevant to even me, I'm looking for objective evidence on the charts so here's what we have so far.

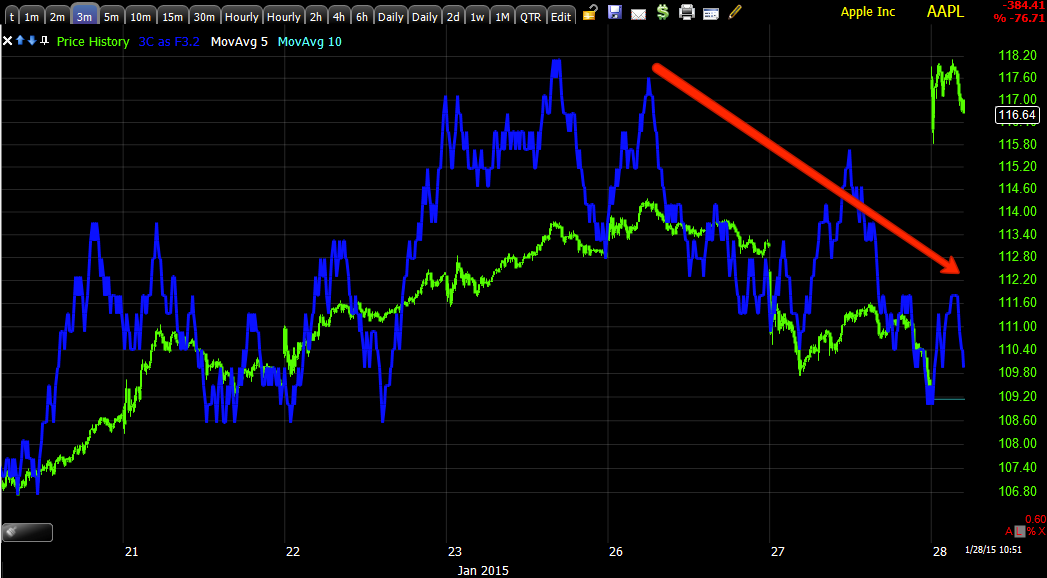
The 1 min chart which isa the fastest moving and "could" have confirmed AAPL's gap up virtually on the open or just a few minutes after, still has not confirmed the gap up, this looks suspicious to me.
This is the 2 min chart from yesterday, it was in a leading positive position as AAPL moved lower in to the close, I show this to you because you have to put today's chart in perspective according to where it was yesterday.
Today's 2 min chart is virtually at the exact same place as yesterday so in reality, the 3C chart hasn't moved any higher on today's gap up either, both of these fast timeframes could easily have confirmed by now, in fact more than an hour ago.
The 3 min chart that is in negative position, is on the border for me, I have seen these move fast and confirming AAPL's gap up by moving to a higher high is certainly possible, as you can see there has been virtually no movement. Thus far I wouldn't say there's any accumulation of AAPL which we wouldn't expect to see by smart money, not in to higher prices like this.
As for distribution, the lack of confirmation suggests there's some going on, but this is a process as well, it's not usually an event just like any price reversal, except the rare and unstable "V" reversals, it's almost always a process rather than an event, although we sometimes act impatiently as if it were an event we expected to unfold at any minute which has more to do with emotions and not wanting to miss a move, I'd prefer to have strong confirmation which requires a bit more patience, but thus far in the early timeframes, this doesn't look good, it's not a smoking gun on the negative side yet, but it's not off to a good start on the 3C charts.
The slightly longer timeframes like 5 min have not reacted at all either, again I have seen a 5 min chart move in an hour or so, but I'd give it the benefit of the doubt for now and allow it a bit more time before assuming this is a negative development on a much more important timeframe.
Here's the 15 min chart, which along with some very long term charts are what suggested to us (as far as objective evidence goes, beyond concepts) that AAPL would break out above the range.
I think this will be a key chart to watch moving forward.
The 60 min chart is in line, I wouldn't expect any significant movement this early as only 2 bars have passed, actually not even since the open. However on a longer term basis, the "in line" with this trend down does have some informational value.
And as mentioned above on the 15 min chart, it was the very long term 6 hour chart that is in a larger leading negative divegrence (negative), but has a weaker, but still relevant relative positive divegrence at the range area,
this is also a big part of the objective evidence from earlier in the week suggesting an AAPL move above the range was a high probability and a set-up for an entry on a head fake move was also a probability being the larger signal here is the leading negative component on a 6 hour chart.


No comments:
Post a Comment