However for the sake of brevity (as much as I can provide) lets just remember The Week Ahead forecast from last Friday which was looking for an "Igloo & Chimney" top formation. Don't bother looking it up, you won't find it, it is one of the price patterns we have documented over and over again. It looks like a typical rounding top that is actually a real top, but it's also very obvious to mist technical traders so after it completes and seems to be heading down, there's a head fake move to shakeout any traders following this rounding top and going short, this is the "Chimney" which looks like an Igloo snow block house with a chimney protruding above the rounding top. The chimney portion is a shakeout, causing traders to stop out and reverse positions back to long and just after, price tends to fall sharply. This is why I often say that this is the best price-based pattern we have for timing of a decline (once we see the chimney) and it is often one of the best places we can enter short positions or exit longs at the best prices with the least risk and great timing. 3C should always confirm this pattern.
In the week ahead, this was the first thing I talked about for this week and every night in the Daily Wrap I have updated the price pattern as it develops exactly as we had expected on Friday. The rounding part of the Igloo was distorted and fell much faster which made me think there's a hurry to get this pattern through.
Yesterday I said that despite some of the divergences in the averages, I wasn't ready to enter any new short term positions as it seemed to me there was a good probability that price would either linger in the area of yesterday's highs or even move to higher highs (the chimney), so far today we haven't been far off considering the additional information of the internals last night that strongly suggested a 1-day overbought condition yesterday that usually ends with a red close the following day (today).
Looking at the averages, they all have nor differences and I suspect that's because they each have different options expiration max-pain pin levels, but there's a theme among them which I'll try to demonstrate, however these aren't very different than the earlier market update, actually the exact same theme.


This is the kind of confirmation we look for to verify this price pattern.
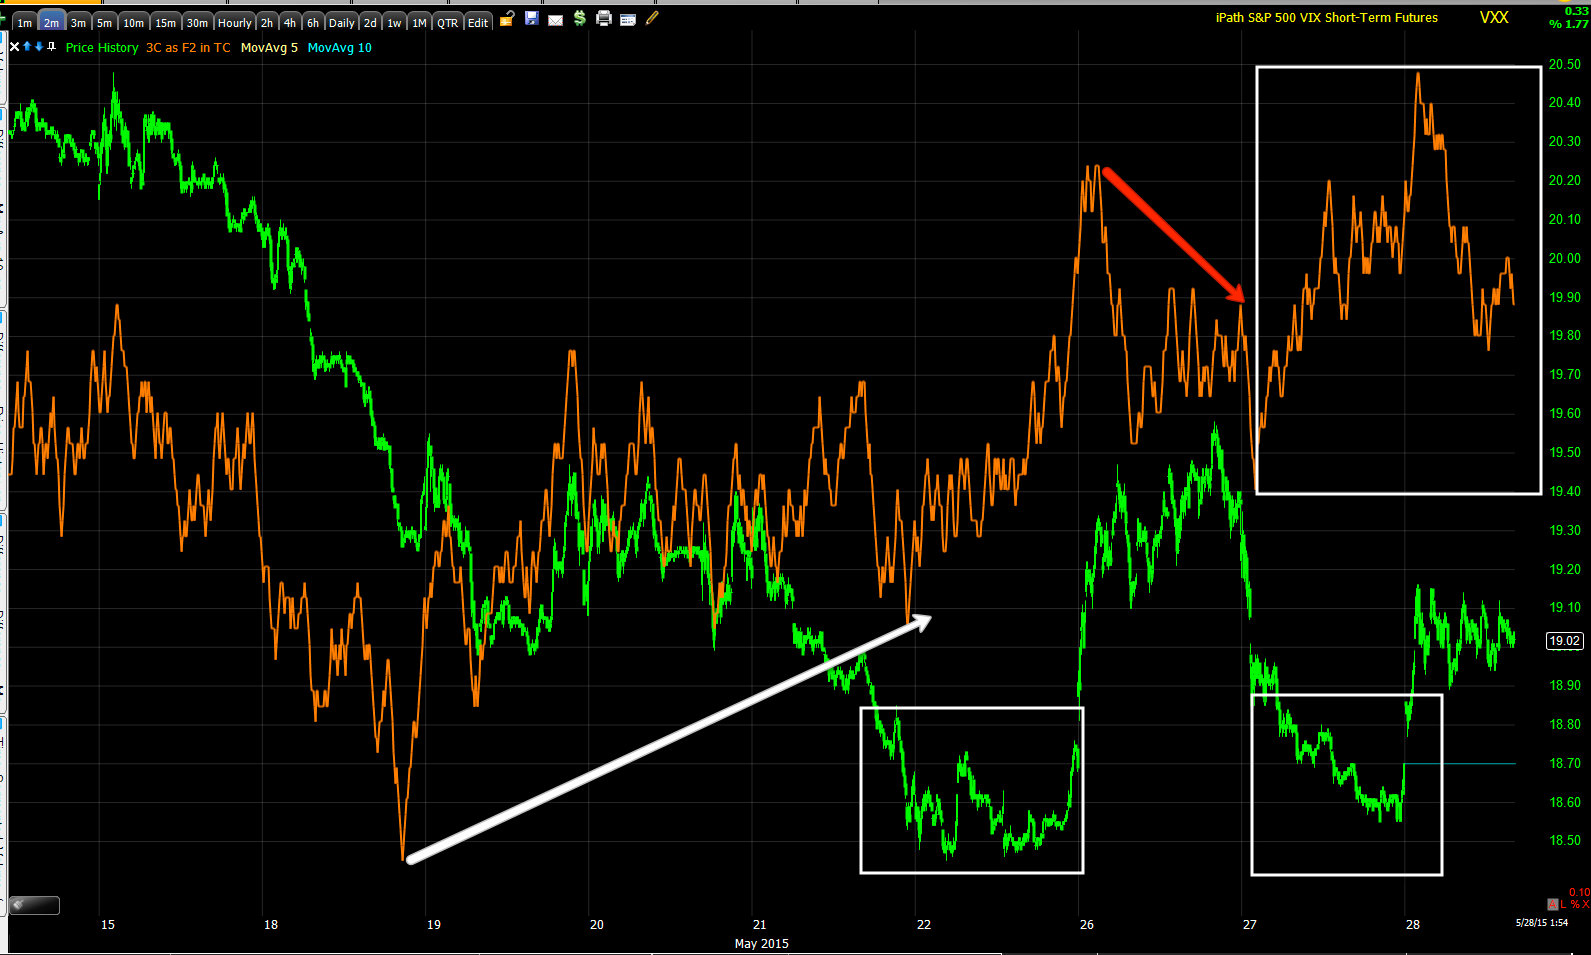
Looking at VXX, I'm not ready to take a position yet and we have been trading rather minor swings in VXX, but it looks like a large move is taking shape and nearly finished with its base. Remember, VIX/VXX moves opposite the market so a move up in VXX= a move down in the market averages.


It gets more interesting looking at the 2 min trend...


It looks like something big is getting ready to happen which is what we have expected since calling for a head fake move above the various market triangles (around mid to late April). At the time the analysis was that the market would not make any serious move to the downside until the clear resistance of those triangles was broken on a head fake move or failed breakout which is what it has turned out to be with no ability to hold the move and certainly no follow through.
Those events all seem to be lining up with our shorter term events above.
While I can't cover it in any depth right now, the counter trend rally in the $USD also looks to be ending with signs over the last 2 days suggesting it is getting ready to end and return to the previous downtrend and make a lower low, something that will cost carry traders. I have a very strong feeling just as I did when we forecasted the strong counter trend bounce which ended up being the strongest 7-day $USD move since 2008, that this is all carry trade related and as such, very much market related as the assets funded with carry proceeds are typically sold as the carry trade is closed.
I'll try to cover the $USD as well.
I don't think we'll see anything significant today or tomorrow, although price strength right now would be welcome to set up longer term trend shorts that are on my watch lists. I've spent the day going through them and they are also giving signals that they are moving closer to trade entries, ironically right in time for the convergence of these multiple events not to even mention the Leading Indicator divergences posted last night.
Again, we'll take the opportunities where we can find them, but this is looking like patience very near term for much larger opportunities than several day option trades.


No comments:
Post a Comment