As an interesting tidbit, the Dow has set a 100+ year record. The Dow has spent 38 consecutive days without making more than a 1 month low or high and this in a tight range of only 1.58%.

The change in trend is a message of the market in its own right as we are no longer moving up, but sideways typical of tops, but remember the volatility we are looking for before we get a serious move to the downside that holds? At a 100 year record tight over the last month, we are certainly primed for it. The next longest streak was 45 days in 1910!
US Macro Data hit ANOTHER new 6 year low today, in fact the pace of decline is so fast that only the Lehman era was slightly faster in the pace of decline, but the F_E_D sees no core deterioration. That's because, as I have made the objective argument, the F_E_D has set-up a subjective set of guiding data points that can all be trumped by the word, "Feel" as in "We feel that inflation will move toward 2%" when they hike rates, even if inflation at the time is moving toward deflation!
Not much has changed otherwise, I still think we have an oversold bounce and more to go than just today. In fact, I suspect we make a bit wider base and here's a quick look at why...


You can see on our custom SPY/TICK histogram the short term capitulation yesterday and improvement today in intraday breadth which gives the 10 min chart above some credibility.
The averages...


Over the last month, you can see the lack of movement in the Dow (White), small caps have lagged badly (yellow) and everything else has been holding together.
VXX puts look great to me for a shorter term trade as does USO short/Puts and I'll show you why below.
Tomorrow is Friday and that means an op-ex pin, even the weeklies. Generally speaking we see the market open pretty close to Thursday's close and an op-ex max pain pin until about 2 pm around the same range. After that, we see the market do whatever it wants and we get some of the best 3C data of the week those last 2 hours. I suspect we get a little wider base as mentioned above already, it doesn't have to be a "W", but those seem to be popular lately on smaller bases.
I think the $USD strength today is very interesting and in a way pulls together all of our positions and expectations both near term and big picture...


The more important signal is the 3C 30 min $USDX suggesting a counter trend bounce...
This is important to all of our current positions and forecasts as you'll see why below...

The $USDX daily chart...

From a longer term perspective, $USD weakness is what the F_E_D wants to see before hiking rates, thus my comments last week about the F_E_D being willing to sacrifice the market as Yellen seemed to make clear yesterday.
The clean uptrend is the carry trade in $USD, otherwise it would normally send the market lower. The yellow trendiness show lower highs and lower lows, the trend is changing and this will have a snow-ball effect on carry trade losses which will have a snowball effect on the $USD and I believe bonds and equities as well as they were financed with Carry trade proceeds. This is why the $USD has been looking so weak on long term 3C charts and the Yen so much stronger.
Note the daily candle in the $USD today, a bullish one, ripe for a counter trend bounce as we expect and this matters why?


Do you think it's coincidence that the $USD has its best day since the end of January today and USO not only had its worst day in a month, but proved our theory of the move above base resistance was a head fake move as price slipped back below the trendily, opening USO up to a FAST REVERSAL (down)?


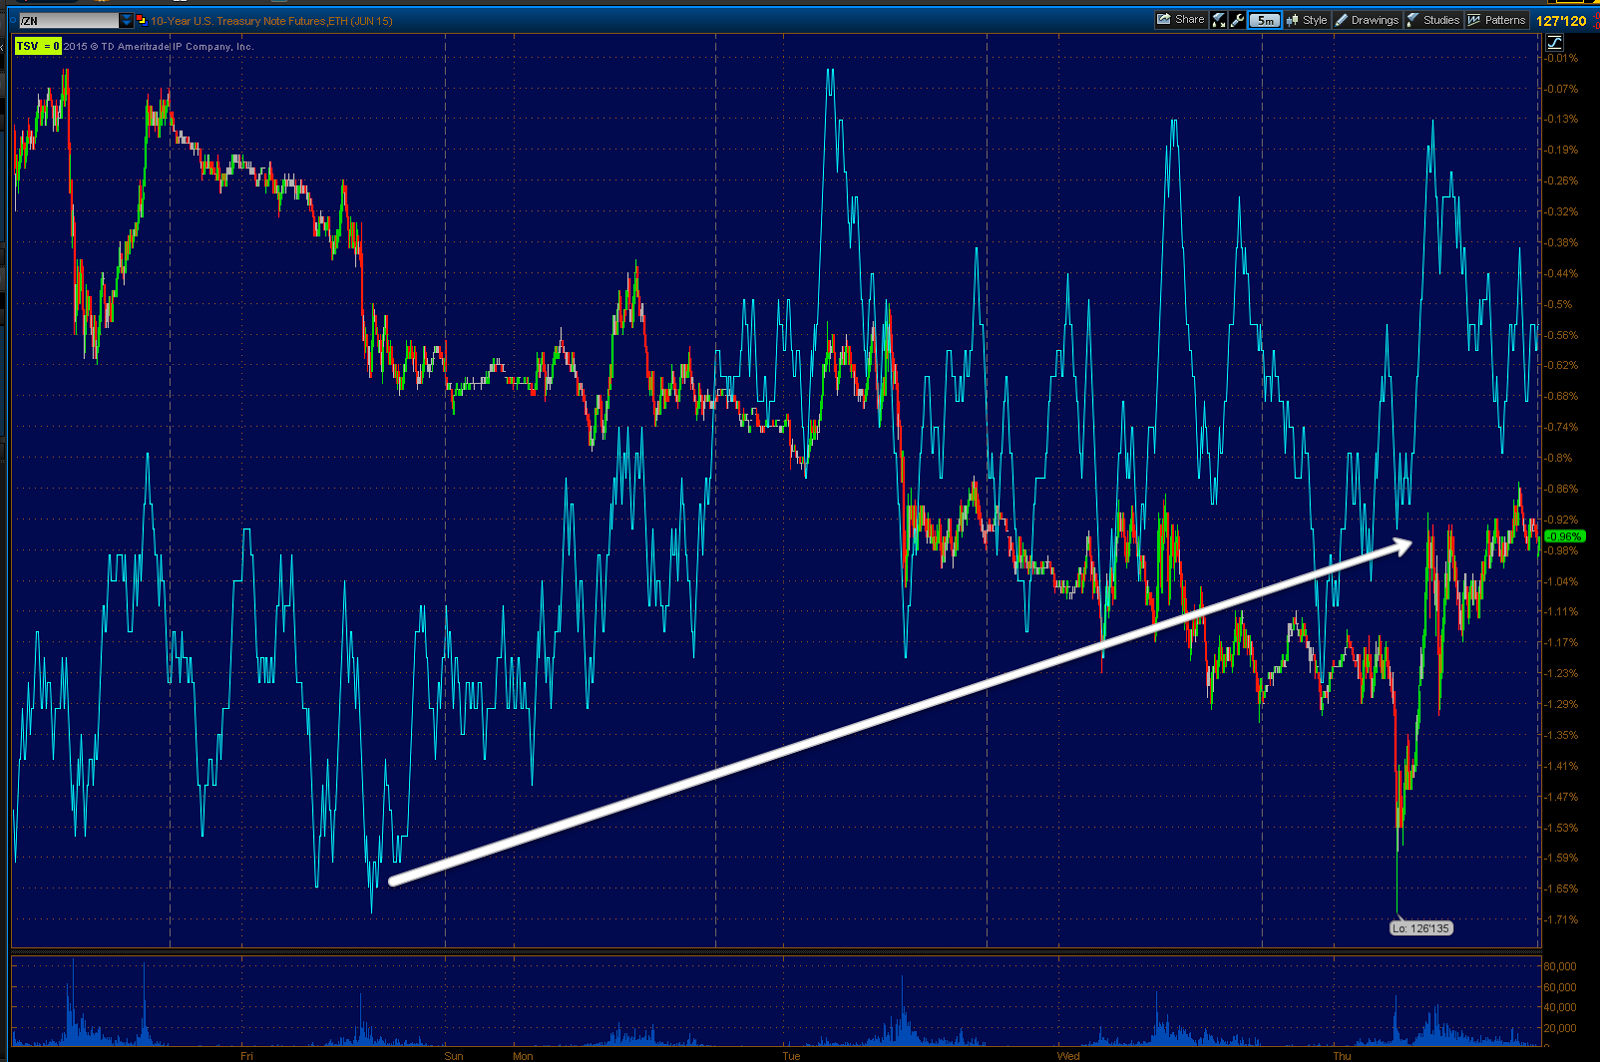
The 5 min chart of 30 year Treasury futures above shows a positive divergence in that base area, while the 1 min chart below...

Suggests a near term (likely tomorrow) pullback to strengthen the base just like equities/the market.
That's solid correlation and additional evidence to back up 3 trades that were all entered on other merits that just so happen to have additional probabilities via the $USD (VXX Puts, USO short & Puts and TLT long & Calls).
However as our longer term or big picture positions go which I posted in last night's Daily Wrap at the bottom, should do very well considering we are expecting a "Counter trend bounce" in the $USD, the trend should continue to make lower lows and when we look at the long term 60 min chart of $USD vs. ES/SPX futures....

You can probably see the leading correlation on your own, but just in case, note the $USD's (purple) leading correlation that has called all of the market pivot highs and continues to move lower as the market puts in a new low on this 60 min chart.
In other words, even our big picture core shorts are in the right place! We'll be looking to add to those on near term price strength in the market in assets such as transports, IWM, NFLX, etc.
I took a quick look at leading indicators today and they are in line with both near term and big picture expectations...

The near term shows support for the market at the shite arrow yesterday as we hit all of those stops that were accumulated, today it remained in line with the SPX.
However on a big picture basis, this is exactly what I said I'd be looking for just after the April 2nd forecast came out so you would know in advance what expectations are. I'll ALWAYS try to anchor expectations in advance.
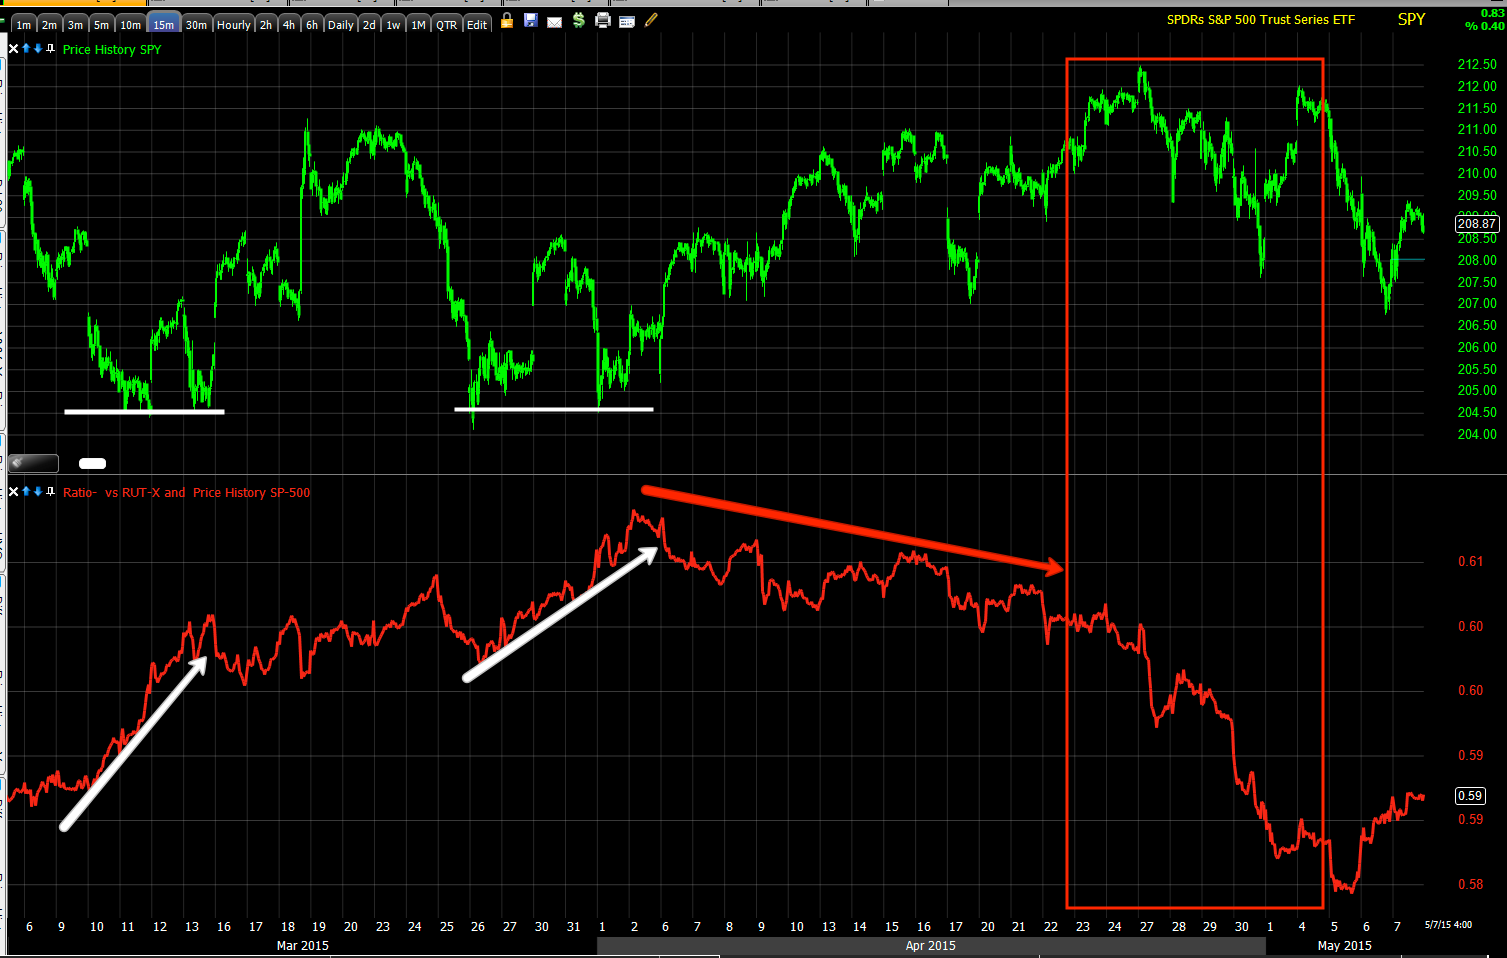
I'd say the chart's/indicator's divergence vs the SPX in green is jumping off the screen with particular deterioration right at last week's head fake move or Igloo w/ a Chimney price pattern/top.

However, I suspect the reason we aren't seeing the same divergences in Index futures (as mostly pros trade index futures while retail trades equities) is because they don't want to take on long risk, but rather let the trade come to them and sell in to it or short in to it, the exact same thing we are looking to do.
That being said, since HY Credit is an asset that is almost exclusively traded by smart money...

I expect any bounce in the market (green) to be met with a deeper divergence in HY Credit as it continues to sell off. Again, exactly the signals we were looking for since our forecast on April 2nd and we saw that in to the topping area from the April run (red box to the right).
I don't think there's much more to say, we have pretty much maintained the same view with minor tweaks as the data comes in. I think our near term positioning and the requirements for any additional positions are quite clear as is our trade plan to let price strength on a counter trend $USDX-based bounce, bring the trade to us at the time of our choosing as well as the confirmation of underlying conditions. We aren't obligated to any risk, that's a good position to be in when l;getting the trade come to you. We are picking our battles and the time and place of them.
Patience is the key. For nearly y a month we had very few trade ideas, but we didn't get caught in the meat grinder. When conditions were right, we started opening trades that have all been winners like the quick NFLX Calls closed May 5th at a gain, USO puts and equity short which is already at a gain, VXX puts with the $23 puts already green, UVXY gains closed down April 30th which we did well with and our additional positions.
Patience and waiting for high probability signals were key in each of those positions.
Wrapping it up, the Dominant Price/Volume Relationship was the same in the Dow, SPX and NDX with no relationship at all in the Russell 2000. There were 18 Dow stocks, 57 NDX and 221 SPX in the Dominant relationship (of 4 possibilities) of Close Up/Volume Down. This is the most bearish of the 4 relationships and fits well with a minor pullback as seen on the 1-2 min intraday charts to widen out a "W" base.
Unlike yesterday, in which internals suggested that the averages close green , which all of them did, today's Sector performance shows 8 of 9 S&P sectors closing green with a short term weak 1-day overbought condition, again pointing to the probability of a minor pullback as drawn on the charts above to create a "W" base.
Tech led today at +.74 (it was the laggard yesterday) and the laggard today was energy at -1.05%.
DOES ANYONE REMEMBER THE DIVERGENCE IN RELATIVE PERFORMANCE I POSTED 2 DAYS AGO BETWEEN ENERGY AND OIL SUGGESTING BOTH COME DOWN?
170 of the 238 Morningstar groups were green as well sticking with the internals themes above.
FINALLY, Futures tonight...
Most of the Index futures are in line and I wouldn't think much of them, however the NASDAQ 100 futures have an obvious negative divergence, again in line with VERY short term (tomorrow) expectations...

If there's overnight weakness on this divergence, I suspect it will be because of a short term move in EUR/USD...


Euro 1 min positive.
This would push the $USDX lower and , well you saw all the correlations.
Index futures would likely see some weakness. I'm expecting a small bounce in oil overnight and Treasury futures would be likely to see some short term weakness overnight which is all fine as it is what we are projecting for VERY near term trade (as in tomorrow).
Otherwise, the event of the day will be the Non-Farm Payrolls at 8:30 a.m. Last month's which came out on Good Friday as the market was closed, were horrendous, something like 127k on consensus of about 246k if I remember with a whisper number going around of a missed print around 150k, it came in even lower than that.
If there's another very weak print and there's some evidence to suggest it, then I'd expect equity strength, treasury strength, gold to sell off, $USD strength, etc. However that's just conjecture until we see the print, we were massively surprised last month, perhaps it surprises in a surprising way.
I hope you had a profitable day today as I know many of you have and of course moving forward both near term and the more important big picture.
Have a great night, I'm off to spend some time with the wonderful Andrea who has dinner on the table (well it has been for the last 30 minutes).

Without her, we'd never get our new website!


No comments:
Post a Comment