Just as much as I believe USO/Oil has made a primary trend base which will offer an incredible trend trade on a decent pullback on a primary trend basis...
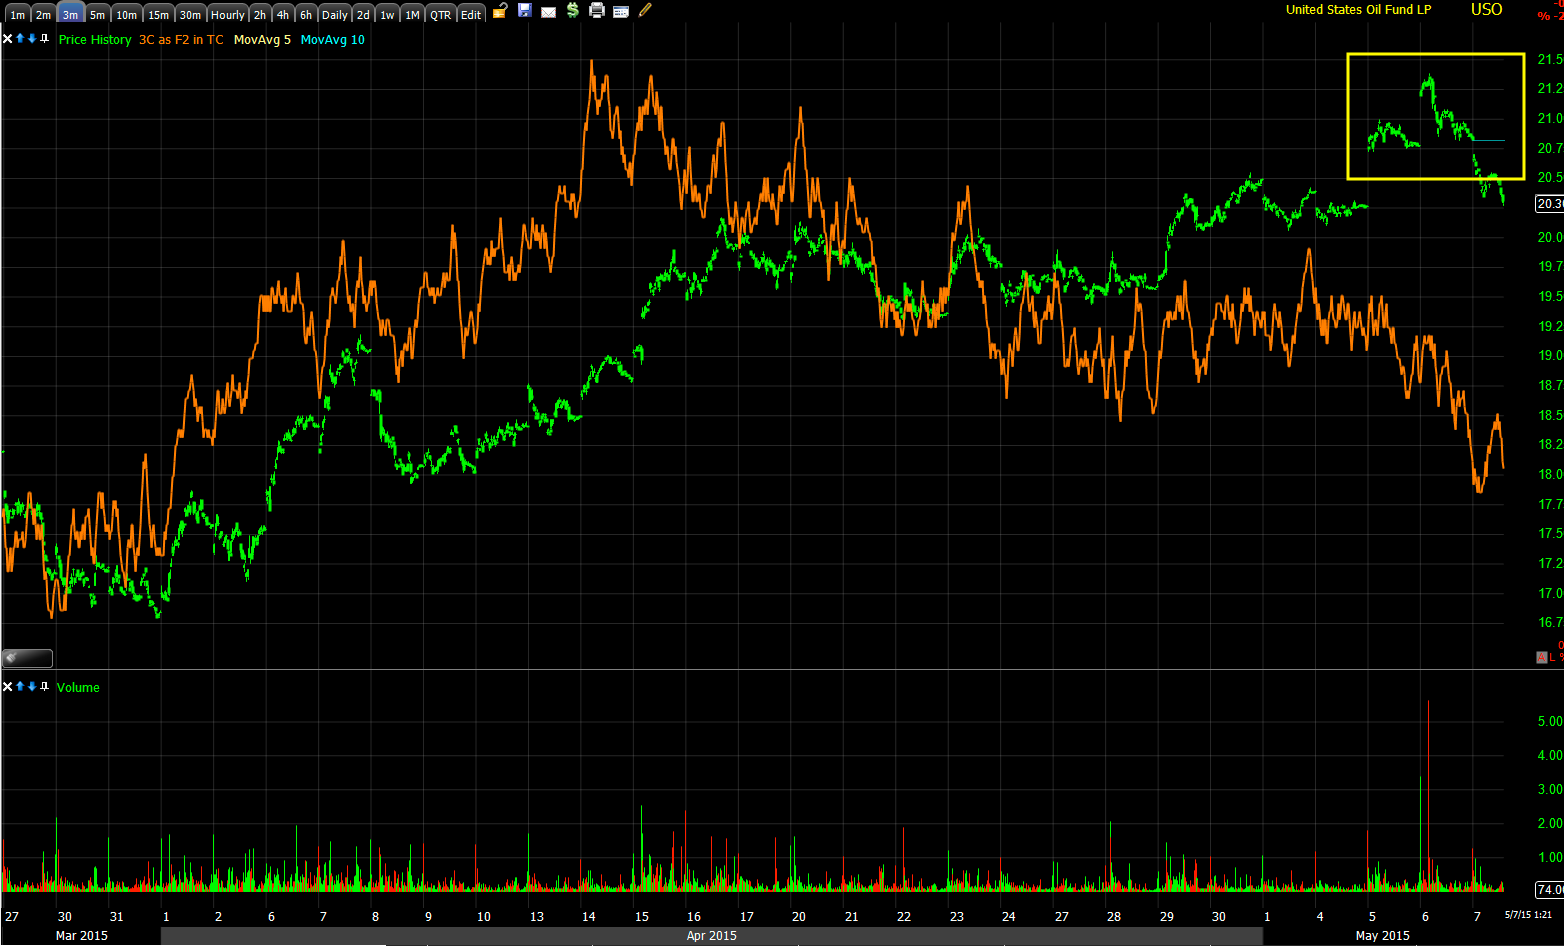
You've seen the 3C long term divergences which called the exact top before USO entered stage 4 DECLINE (left). Note the low volume which is characteristic of a bear market. This is Don Worden's (
the father of money flow indicators) last great indicator, MoneyStream which I'm showing as confirmation of the longer term 3C charts that have shown the same, a stage 4 decline in to a price trend change from down to lateral (
indicative of a base if accumulation is present as it is).
So as strong as I feel about USO eventually putting in a trend reversal and entering a primary (bull market) uptrend once it has truly broken free of this base...
I have been equally as committed to the idea of a USO pullback,
that USO , while having done the work, is not quite ready for a transition to stage 2 Breakout/Mark-up or rally. I want to enter USO long at a lower level and I believe that is the highest probability (
long before the crowd jumps on and those that have, I believe they will be shake out).
The very strong 3C 60 min chart which has been PERFECTLY in line with price in the base area and only diverged negatively on the last run up toward the top of the base indicating to me that it is not ready for a serious attempt at a stage 2 breakout.
This is a VERY hard call to make because USO is right there where I have expected it to be (eventually) and in position (price based) to make a run at stage 2 mark-up as the actual price-based indication is that of a breakout so calling for a pullback here requires me to have a lot of faith in the 3C signal above.
However if you have read our articles on Head Fake moves that are always linked near the upper right side of the member's site, "Understanding the Head-Fake Move", then you'll know why I put forth this idea last week as a possibility/probability.
The more defined a technical level like Resistance in USO's case and the more visible the asset (oil has had a ton of attention), the more probable a head fake move or in this case a false breakout/failed breakout and that's on top of the base-line estimated probability of an 80% chance no matter the asset or timeframe before a significant reversal (either up or down).
In other words, based on strong resistance in USO, the suggestion last week was that it see a head fake/false breakout ABOVE base resistance before turning lower as expected...
Here is the actual move proposed last week as resistance is very clear and limit/buy orders would be sitting just above the psychological whole number resistance area of $20 creating a false breakout. Both days have bearish daily candlesticks with larger upper wicks showing higher prices rejected intraday and both on increasing volume indicative of bearish churning or strong hands selling to weak hands,
Today USO sits right at the former resistance level (for now support).
I have not only left the USO equity short positions and Put positions open, but increased them all to maximum size allowed by my own risk management rules.
Here's where we stand as of now...
USO showing another churning Point at the head fake above resistance on this one hour chart
CL/ crude futures four hour chart negative like USO's one hour chart.
Crude futures 60 minute negative
Crude futures 15 minute showing the accumulation necessary to break above resistance in white and the distribution once above. The concept to remember here is, "
failed moves produce fast reversals".
USO two minute trend with bass resistance at the yellow trendline, the rest of the charts speaks for itself.
The same distribution trend it is apparent in the three minute chart once the head fake move is made
From left to right at number one we have small distribution forming the base's top or resistance area where it is sent lower to be accumulated as it is at the base's bottom at #2. then the same kind of distribution at number three which failed to send USO lower as several macro events such as the Saudi oil ministers comments as well as the first draws in inventory. A head fake move was likely necessary to create the downside reversal and you can see strong distribution on this 10 minute chart as that breakout occurs.
The 15 minute chart shows the exact same thing.
This is crude in candlesticks on the one minute chart versus the US dollar in purple. Our recent analysis of USO has counted on US dollar strength to create USO downside via the Legacy arbitrage correlation.
Since starting this post, USO has touched support on a move lower. With charts like that 10 minute and 15 minute which are screaming, I have little doubt USO will move lower and both our Equity short and Puts will see nice gains.


No comments:
Post a Comment