I had to go back a ways and look through a lot of posts to find all of this, but I think when you are talking about concepts that we have come to rely on, it's worth the time to go back to when they were throwing red flags and show exactly what those were, you'll see they are the same concepts we use every day today.
Last year (2014) treasuries significantly outperformed equities, TLT +23.25% on the year vs the SPX at +12.39% on the year.
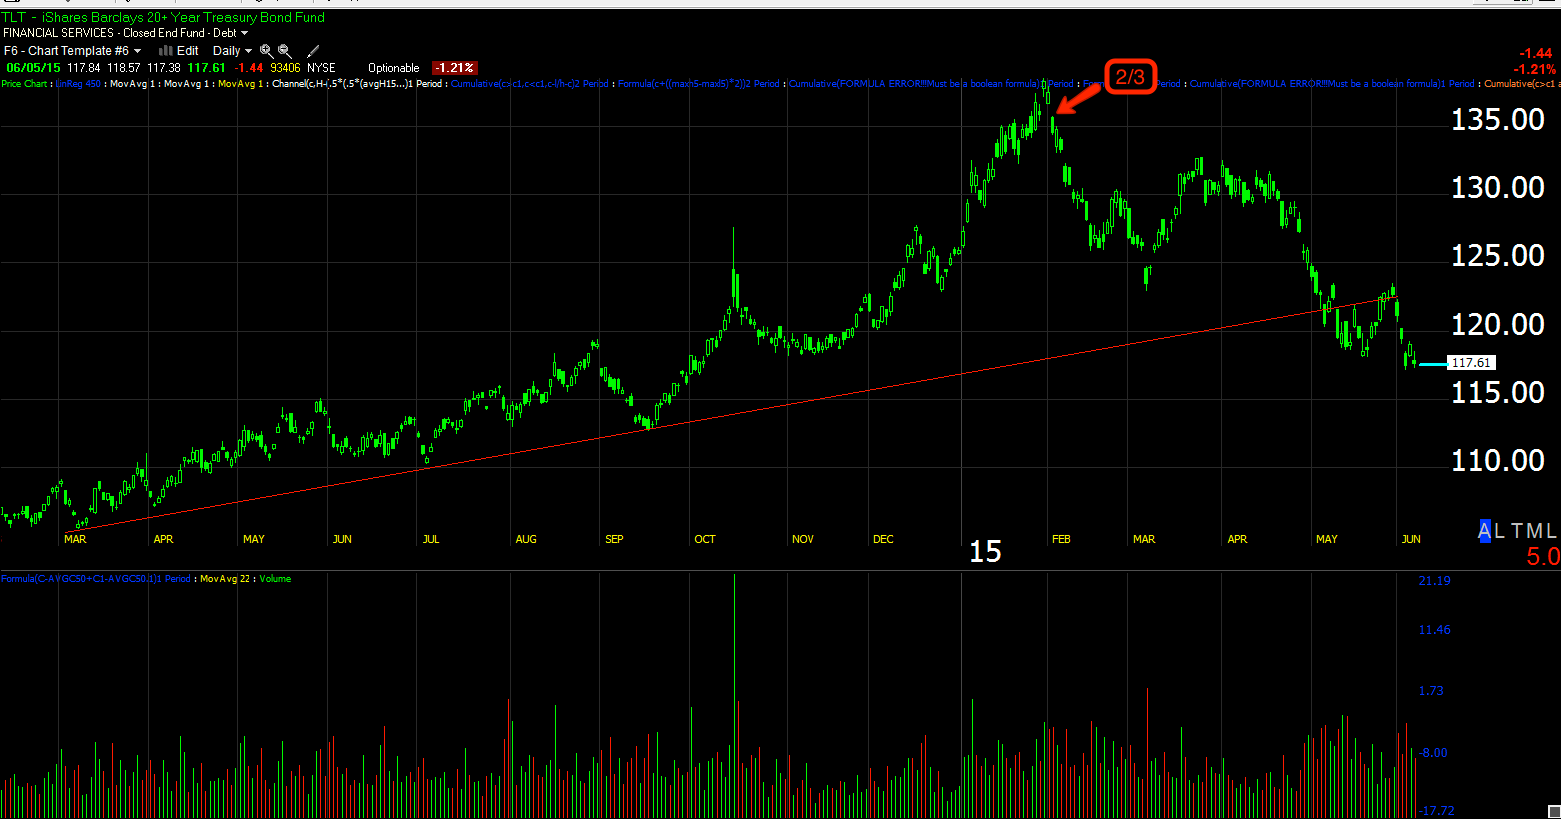
We had a lot of solid TLT (20+ year Treasury) long trades, however the charts below come from a post from February 3rd, 2015 which would have looked like this...
I'm picking out the excepts from this post from Feb 3rd 2015, Treasury Futures/ TLT Update because it is long and deals with things like duration which are not necessarily relevant to the points ahead, although feel free to read it if you like. In looking back to the F_O_M_C meeting that had just occurred and the top in the $USD shortly after, it seems very clear to me that smart money knew as far back as January when the probable start in interest rate hikes would be and started moving quickly considering the sizes of their positions. Pay attention to the details below and you'll see that not only does this seem to tell us smart money ones a lot more than we are being led to believe right now, but some of the things happening at the time (remember we were only 3-days off the all time high in TLT when this was posted) are a reflection of smart money closing the carry trade; one of the first signals of such is a fall in bond prices. You'll also note things like CNBC calling bonds a buy as they had already topped..coincidence? Below the larger italic text from the Feb. 3rd post, I'll pick up on the current TLT charts.
*Bold lettering added by me now for emphasis*
"Since our last trade idea in TLT (2x levered long via shorting TBT) which made a decent gain (and treasuries overall outperformed stocks last year with an 11% gain), I've seen something that caused me to close out the idea, something TLT hasn't shown for a while.
In 2014 bonds outperformed equities, +11% on the year. However things are obviously changing....
First lets look at TLT because it is exhibiting not only 3C red flags, but price action red flags as well.

I often say that this , "bullish looking" price action is a "Red Flag" warning of a trend change to come. Increased price volatility is a feature we often see just between changes of trends or stages, it's what creates the Channel Buster.
This daily chart alone with a near parabolic daily chart in TLT is enough for me to back off the position.
 The long term 60 min chart in TLT for the longest time has been in line or price confirmation, the most recent divegrence is a relative negative on a long timeframe of 60 mins. The white box and arrow is where we entered the last TLT long (2x long via shorting TBT to create the leverage) which was recently closed out because of the 3C charts, but not this one.


Treasury Futures, ZB=30 year, ZN= 10 year, ZF= 5 year and ZT=2 year...
First the 30 min charts...


Once again, let me remind you that this was not "Monday morning quarterbacking" or after the fact, this is what TLT looked like on the close the day this was posted...


The concepts and signals that were written about then are the same ones we use everyday, we just happen to have the benefit of hindsight now.
I would recommend reading the next post which deals with the "Channel Buster" concept and why TLT or "How" should see its power to make a strong counter trend rally. If the $USD's recent projected counter trend rally is anything to judge by, the TLT move, once confirmed should make a stronger upside move than we have seen at any point in TLT's past.
Since I've already written at length about the Channel Buster concept and how that fuels a strong reversal move, I'll just link to the post, Bond Rally / Swing. This is the overall trade set-up, 3C charts at this point just help us confirm and identify timing for entries.
I am not claiming that Treasuries should see a true reversal back to the upside, I believe they are setting up for a counter trend rally which are some of the strongest rallies you can see in any market whether bull or bear.
As for TLT's current charts moving forward, where we are and what we might look for...

I know it can be hard to remain patient when you see the possibilities of a great race and the chances it may slip right by you, but I believe patience has given me the chance to be able to survive long enough to let some of those great trades become profitable rather than entering them, getting bumped from them and then watching them take off.


On this larger 10 min chart showing what will likely be a double-bottom shaped base, the buying seems to stop in the $122-$122.40 area and they send prices lower again.

When the leading positive divergence at the section labelled "A" shows up in like manner or stronger at the section labelled "B", I would say the 3C charts will be screaming and that's a trade I don't ignore, but until then, I trust in confirmation and strong signals. If I miss the trade, just like $USD made a huge move a week ago, They'll be another.


No comments:
Post a Comment